

DSTDEVP in Calligra Sheets: Population Spread for Matching Database Records
Learn Calligra Sheets DSTDEVP with exact arguments, reproducible inputs, independently checked results and implementation-specific cautions.
Verification status: See the evidence and test scope described in this guide. How formula examples are checked
Quick answer
DSTDEVP(database; field; criteria) returns the population standard deviation of the selected field for database records satisfying the criteria. It divides the summed squared deviations by n before taking the square root. Choose the population or sample interpretation based on what the records represent, not on which gives a preferred number.
Syntax and table layout
=DSTDEVP(database; field; criteria)
All three arguments are required. The database range includes a header row. The field is a header string, matched case-insensitively by the inspected helper, or a one-based column number. The criteria range also includes a header row whose labels identify database columns, followed by conditions.
Conditions on the same criteria row are ANDed; separate criteria rows are ORed. Empty criteria cells add no condition. An unrecognized criteria header is ignored by the source parser, so a spelling error can silently broaden the selection. Use real headers and inspect the matching rows before interpreting the statistic.
Reproduce a small numeric example
Enter this database in A1:B5:
| Team | Amount |
|---|---|
| East | 10 |
| West | 40 |
| East | 20 |
| East | 30 |
Put Team in D1 and East in D2. Enter =DSTDEVP(A1:B5;"Amount";D1:D2) in F2. Expected result: 8.1649658093. Replacing "Amount" with numeric field 2 gives the same result.
The selected observations are 10, 20 and 30. Their mean is 20, and their squared deviations total 100+0+100 = 200. Dividing by 3 gives population variance 66.6666666667; its square root is approximately 8.1649658093. This is independent arithmetic, not a cached workbook result.
Practical example: restrict a team’s report to larger observations
Put Team and Amount in D4:E4, with East and >=20 in D5:E5. Use =DSTDEVP(A1:B5;"Amount";D4:E5). Both conditions must hold, leaving 20 and 30. Their mean is 25 and squared deviations total 50, so the expected population standard deviation is 5.
This is a subgroup statistic, not the spread of the whole database. Record the filter conditions beside the result. Moving the two conditions onto different rows would change AND to OR and could select a different population.
Empty groups, one record and data quality
- With a Team criterion of West, only 40 matches; the expected result is 0. One observation has zero population spread.
- With North, no rows match and the helper returns #DIV/0!.
- An unknown selected field such as
"Missing"returns #VALUE!. Use a valid in-range column number; this guide does not promise bounds validation for oversized numeric indexes. - The variance helper counts nonempty selected values, not exclusively numeric values. Keep the measurement field numeric and clean; do not assume text/Boolean handling matches another spreadsheet’s database functions.
- Criteria comparisons use the common engine, including settings-dependent text patterns. Literal consistent labels and simple numeric comparisons are the worked scope here.
- Blank criteria rows can match broadly, whereas a criteria range containing only headers supplies no matching condition row. Check the exact rectangle.
The KDE DSTDEVP reference describes database standard deviation. The source calls the corresponding database variance helper and takes its square root; its record-selection and count rules explain the limits above.
Availability and verification
- Release checked: Calligra Sheets 26.08.2, using KDE’s release source package and release information, inspected on October 18, 2026. Relevant locations:
sheets/functions/database.cpplines 66–73, 99–221 and 439–531. - Introduced: The original introduction version is not established by these sources. Current registration establishes presence in 26.08.2, not the first release.
- Lifecycle: Registered in the inspected release; no retirement or deprecation marker was found in this function’s registration. Retirement (removed support) and deprecation (discouraged but retained support) are different claims; neither is asserted here.
- Native testing: Selected cases were observed in Calligra Sheets 25.04.2, as shown below. The source discussion concerns 26.08.2; other examples and unlisted edge cases remain separate source or mathematical evidence.
Related guides and sources
- STDEVP
- DAVERAGE
- DCOUNT
- DSUM
- Calligra function guide index
- KDE formula entry instructions, checked October 18, 2026. Examples use leading
=and semicolons, with a period for decimal numbers. Confirm regional separators in your installation before pasting.
Selected native results and screenshot
These cases were evaluated and saved in Calligra Sheets 25.04.2 using a prepared ODS workbook. The saved formulas and results were read back, with displayed error text taking precedence over numeric error caches. The native checks establish these particular cases, not full cross-product compatibility.
| Native formula | Observed display |
|---|---|
=DSTDEVP(A1:B5;"Amount";D1:D2) |
8.1649658093 |
=DSTDEVP(A1:B5;2;D1:D2) |
8.1649658093 |
=DSTDEVP(A1:B5;"Amount";D4:D5) |
0.0000000000 |
=DSTDEVP(A1:B5;"Amount";D7:D8) |
#DIV/0! |
=DSTDEVP(A1:B5;"Missing";D1:D2) |
#VALUE! |
The selected East values produced population standard deviation 8.1649658093. The singleton West selection returned 0, while empty North returned #DIV/0!. This confirms the distinction from the sample statistic for these numeric observations. The advanced two-condition example remains independently calculated.
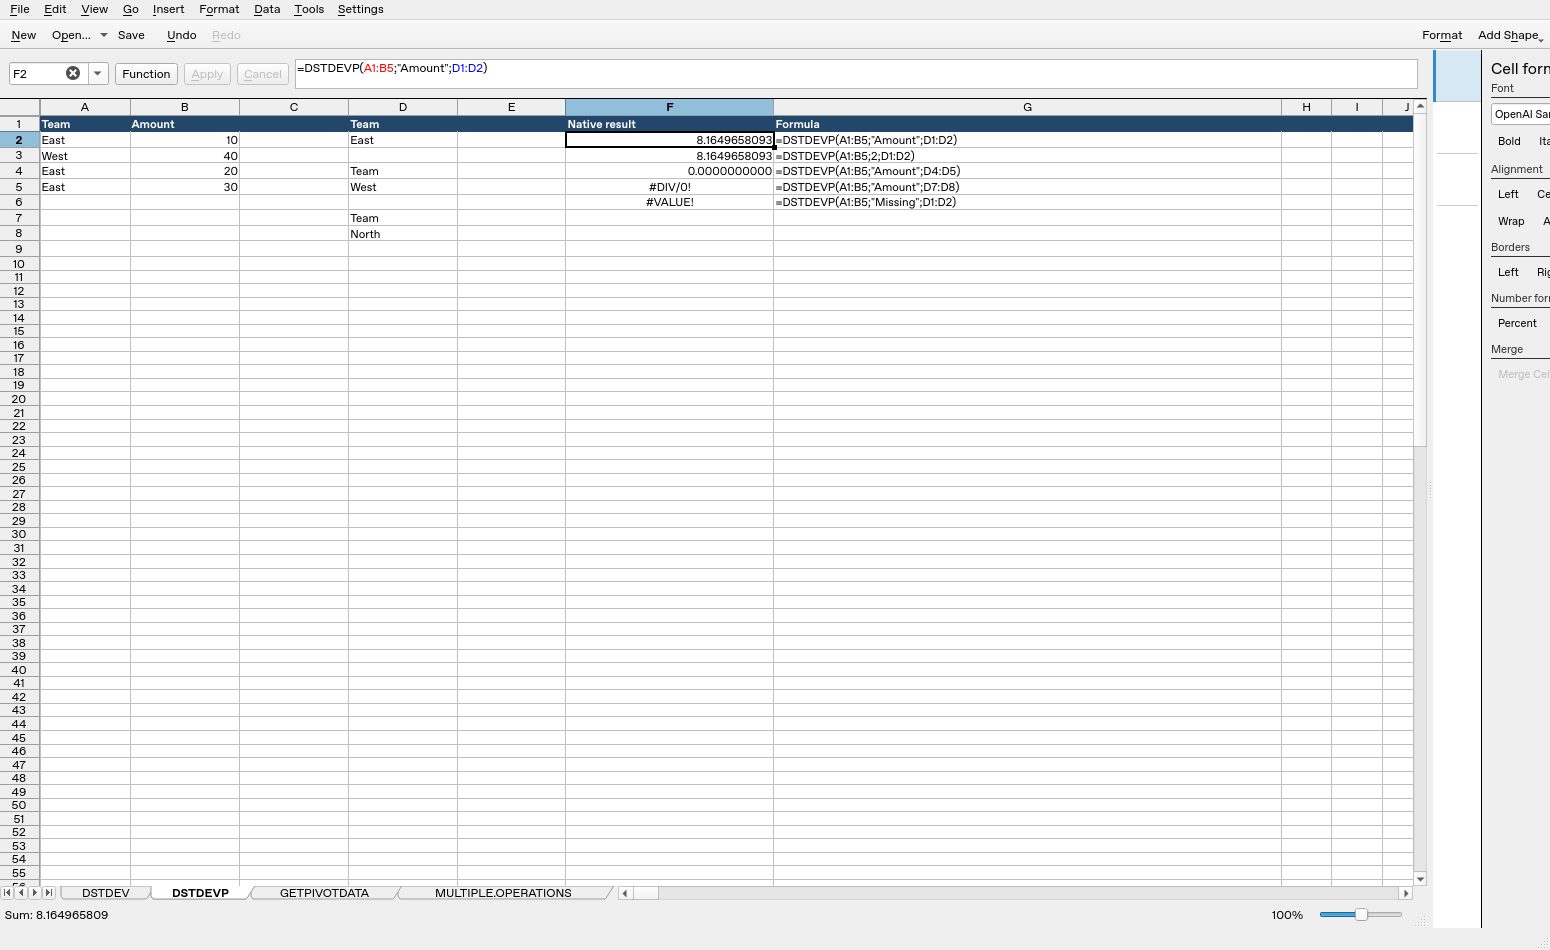
Screenshot: Selected F2 contains =DSTDEVP(A1:B5;"Amount";D1:D2) and displays 8.1649658093. Column F contains application results, and column G contains formula labels. The selected expression is visible in the formula bar.