

Your software learning hub
Gnumeric
Spreadsheet formulas, statistics and numerical analysis
Learn Gnumeric spreadsheet formulas through worked examples, specialized mathematics and function reference guides.

Illustrative worksheet · Not an application screenshot
Start with one practical task
Enter four expenses, check the remaining budget and test a saved copy.
Applies to: Gnumeric desktop; manual 1.12 procedure.
Evidence: Documentation and fixture checks; native save/reopen unverified.
What would you like to do?
Choose a task to explore the published guides.
About Software
An introduction to this program and the learning material available here.
Overview · Learning paths Explore the toolsFeatures Reference
Browse practical feature tutorials organized by category.
Categorized feature guides Find the right formulaFunction Guides
Find syntax, worked examples and notes for individual functions.
Function A–Z Learn by doingTutorials
Follow practical lessons for everyday spreadsheet tasks.
Step-by-step workflows Get unstuckTroubleshooting & Error Reference
Find published guides for diagnosing errors and unexpected results.
Troubleshooting guides Compare your optionsCompatibility & Migration
Compare formulas across programs and check documented differences and research gaps.
Cross-software formula comparisons Start with a useful workbookTemplates & Downloads
Browse published templates, practice files and downloadable resources.
Reusable spreadsheet resources Check what applies to youVersions & Availability
Find published version and platform guidance for this program.
Version and platform guidanceAbout Gnumeric
Gnumeric is an open-source spreadsheet application with advanced analytical and mathematical capabilities. It can serve both ordinary calculation tasks and more specialised numerical work. Start with common formulas, then explore specialised functions such as SINPI and COSPI. The Gnumeric project maintains the full official function catalog, including implementation and testing notes. Those project notes are not evidence that this site’s examples have all been executed natively.
Begin with a workbook you can verify
A useful first task is a small expense workbook: each row records an item, quantity and unit cost; another column calculates the line amount. Keep a budget input apart from the calculated total and check that changing a quantity changes the appropriate outputs. The first expense workbook tutorial follows this path through saving, reopening and a reversible input change. It provides independently checkable results rather than asking you to trust a formatted total.
Next, study SUM and use the function directory when you need a particular calculation. For workbook tools and analysis workflows, use the feature reference and tutorial directory. A specialised function is useful only when its inputs and assumptions match the problem; being listed in Gnumeric’s catalog does not make it portable to another spreadsheet program.
Check the platform and the exchange format
The official download guidance recommends distribution packages for nontechnical Linux/BSD users and states that the project does not currently distribute Windows binaries. Consult versions and availability before using instructions or function names from a newer release than your installed package. An old third-party installer is not evidence of current official platform support.
Keep an original workbook before exchanging files and use compatibility and migration to plan checks of formulas as well as displayed values. Templates and downloads explain practice-file formats and limitations. If a result fails, follow troubleshooting or the error reference with the exact inputs, formula, version and file type. Our guides distinguish documentation checks from native-app testing; this overview adds no new application run or screenshot claim.
Worked example: Plot paired measurements
These four time-and-distance pairs use an XY chart so unequal time gaps remain unequal on screen. The points are (0,0), (1,3), (4,12) and (10,30), with four numeric entries in each column. Follow the paired-values scatter-plot tutorial to assign the ranges and check the geometry.
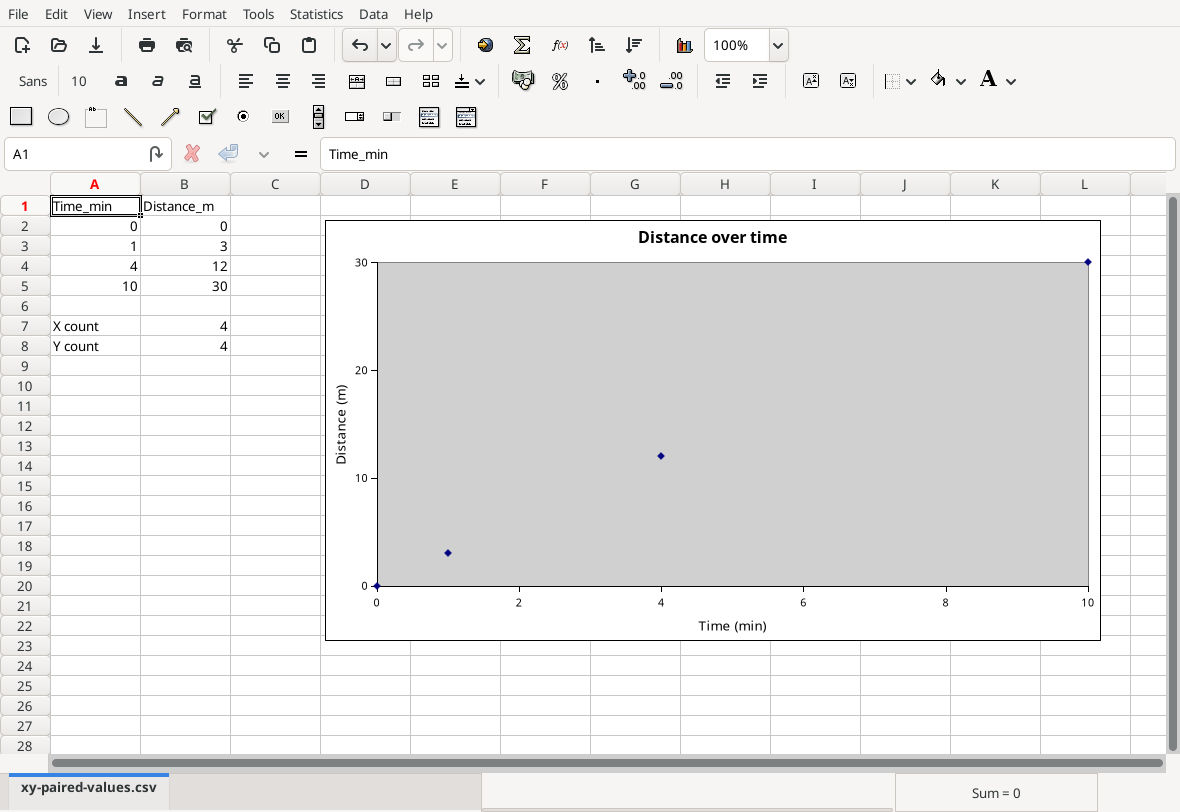
Gnumeric 1.12.57 with GOffice 0.10.57 on Debian 13.6 Linux, English interface/C locale; native capture from 16 October 2026. Saved-chart reopening was not tested. Select the image for full size.
This reuses an existing guide’s historical native screenshot; adding it to this overview involved no new application run or capture. Its evidence applies to the selected example and recorded build, not every version or platform.