

FREQUENCY in Calligra Sheets: Count Values in Numeric Bins Safely
Build interval counts with vertical upper limits and recognize an inspected endpoint safety issue.
Verification status: Consult the documentation, examples and any stated test scope below. How formula examples are checked
Quick answer: for data 5, 10, 15, 20, 35, 90 and ascending upper limits 10, 20, 40, FREQUENCY produces counts 2, 2, 1, 1. The fourth count is for values above the final limit.
Important implementation caution: in the inspected Calligra source, the bin search result is dereferenced without checking whether it is past the end of the numeric data. A bin at or above the maximum, or an empty numeric dataset, can reach that unsafe path. No crash is claimed here; those cases were deliberately not executed. The examples keep every bin strictly below an actual maximum data value. For a general-purpose histogram without this restriction, use explicit conditional counts instead.
Syntax and interval meanings
=FREQUENCY(data; bins)
Both arguments are required. Use numeric data and a single-column ascending range of numeric bin upper limits. The first count includes values ≤ the first limit. Each middle count includes values greater than the preceding limit and ≤ the current limit. The final additional count includes values above the last limit.
The implementation filters data to numeric values; text and blanks are not observations. Bins must have one column. Do not use a horizontal row of bins, unsorted limits or text placeholders as a substitute for a clean ascending column. The output is a column array with one more row than the number of bins.
Worked worksheet: processing times
Enter these values as minutes in L2:L7: 5, 10, 15, 20, 35, 90. Put literal text text in L8 and leave L9 genuinely blank. Enter 10, 20, 40 in M2:M4.
Read the four output elements with ordinary formulas:
| Formula | Interval in minutes | Expected count |
|---|---|---|
=INDEX(FREQUENCY(L2:L9;M2:M4);1;1) |
time ≤ 10 | 2 |
=INDEX(FREQUENCY(L2:L9;M2:M4);2;1) |
10 < time ≤ 20 | 2 |
=INDEX(FREQUENCY(L2:L9;M2:M4);3;1) |
20 < time ≤ 40 | 1 |
=INDEX(FREQUENCY(L2:L9;M2:M4);4;1) |
time > 40 | 1 |
The counts sum to six numeric observations. The exact values 10 and 20 belong in the bins ending at those limits, not the following bins. The text and blank do not increase the total. Every tested limit is below the maximum of 90, avoiding the source endpoint risk described above.
This INDEX route checks the returned array’s elements; it does not establish automatic spilling or a tested multi-cell array-entry shortcut.
Advanced use: proportions and an alternative count
Divide the counts by six to obtain relative frequencies 1/3, 1/3, 1/6, 1/6. These are sample proportions, not automatically population probabilities. Unequal-width bins also mean bar counts are not probability densities; a density-style histogram must account for interval width.
For a clean numeric range, the second bin can instead be checked using =COUNTIF(L2:L7;"<=20")-COUNTIF(L2:L7;"<=10"), with expected value 2. Explicit conditional counts avoid this function’s unchecked bin-search path and let you include a final threshold at the maximum. Keep the data-cleaning policy consistent when comparing methods.
Do not append an invented large measurement merely to work around the safety issue: it would alter both the overflow count and sample denominator. If genuine data do not satisfy the safe example’s restriction, choose the alternative approach.
Errors and compatibility
A horizontal bin range is explicitly rejected with a value error. The source has a special empty-bin branch intended to return the numeric data count, but the exact range/empty-value representation is not established by the examples here. Use explicit bins rather than relying on that branch.
The familiar FREQUENCY name must not be taken as assurance of another spreadsheet’s safety or empty-input behavior. COUNTIF can express individual thresholds; COUNT helps check the numeric denominator. Validate the interval labels and data count as well as the displayed array values.
Version scope and references
Reviewed October 18, 2026. The relevant implementation file and shared numerical/conversion files were compared between official 25.04.2 and 26.08.2 source and are byte-identical. This establishes source equivalence for the inspected code, not identical behavior on every platform or a native test of 26.08.2. The earliest release containing FREQUENCY has not been established; these version numbers are not introduction dates.
Mathematical reference values above were calculated independently. The native results below were obtained in Calligra Sheets 25.04.2 on Linux, October 18, 2026; no native 26.08.2 execution is claimed. No unstated locale, import or array-entry behavior is implied.
Native verification in Calligra Sheets 25.04.2
These formulas were recalculated in the actual application and read back from its completed native-saved workbook. The image is an unmodified application screenshot. The earlier mathematical calculations remain independent references; this table records actual saved results.
The array checks retrieve individual elements with INDEX. They establish the listed values and orientation, not automatic spilling or a tested direct multi-cell array-entry shortcut.
Native L2:L9 contains 5,10,15,20,35,90,text,blank; M2:M4 contains 10,20,40. H10:J10 is a horizontal numeric range used only to confirm early bin-shape rejection. No unsafe endpoint or empty-data call was executed.
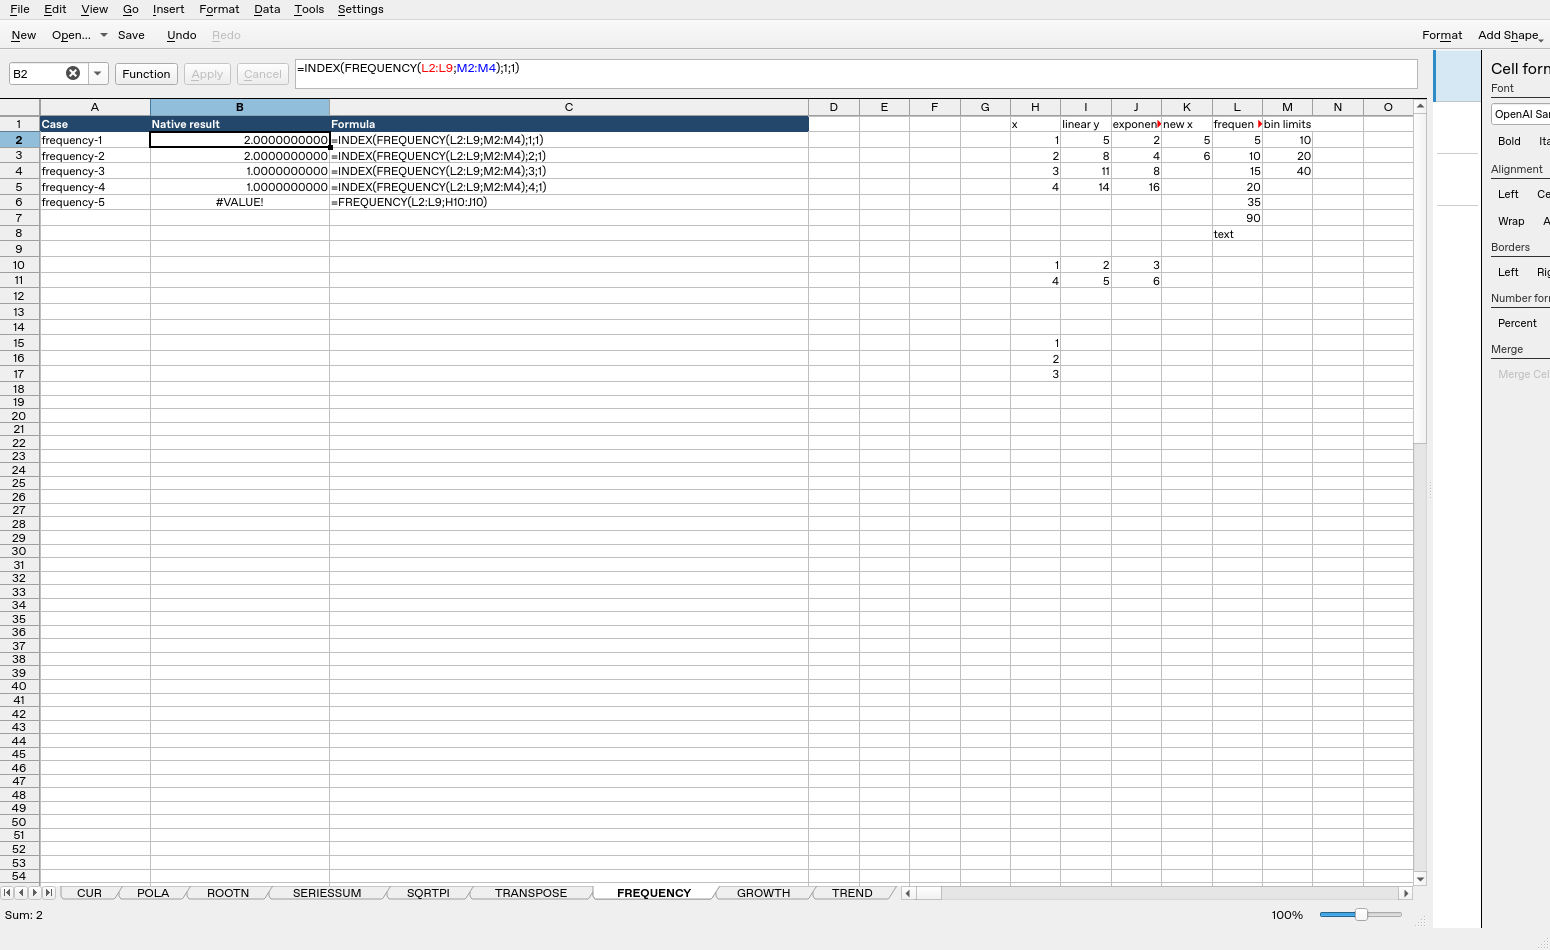
| Formula executed | Native saved result |
|---|---|
=INDEX(FREQUENCY(L2:L9;M2:M4);1;1) |
2 |
=INDEX(FREQUENCY(L2:L9;M2:M4);2;1) |
2 |
=INDEX(FREQUENCY(L2:L9;M2:M4);3;1) |
1 |
=INDEX(FREQUENCY(L2:L9;M2:M4);4;1) |
1 |
=FREQUENCY(L2:L9;H10:J10) |
#VALUE! |
Display formatting may show fewer digits than the saved value. The tested cases do not establish every coercion, extreme magnitude or cross-application import behavior.