

TREND in Calligra Sheets: Predict Values with a Linear Fit
Use explicit paired ranges for linear predictions and understand horizontal output and optional-input hazards.
Verification status: Consult the documentation, examples and any stated test scope below. How formula examples are checked
Quick answer: known x values 1, 2, 3, 4 paired with y values 5, 8, 11, 14 follow y = 3x + 2. TREND predicts 17 at x=5 and 20 at x=6.
Syntax and a necessary safety restriction
=TREND(known_y; known_x; new_x; allowOffset)
Use the first three arguments explicitly; the fourth defaults to true. Although the handbook and registration allow omitted x arguments, the inspected implementation reads argument positions 2 and 3 without first checking that they exist. Function dispatch does not pad this array-enabled call. Fewer-than-three-argument forms were not executed and should not be relied on in these releases.
Use equally sized numeric known-y and known-x ranges, with at least two distinct x values, and an explicit nonempty numeric new-x range. With allowOffset true, the function fits y = a×x + b. With 0/false, it fixes b=0 and uses a = Σxy/Σx². A forced zero intercept is a modeling constraint, not a formatting option.
Worked worksheet: a simple calibration
- Enter known x values 1, 2, 3, 4 in H2:H5.
- Enter corresponding y values 5, 8, 11, 14 in I2:I5.
- Enter new x values 5, 6 in K2:K3.
- In A2 enter
=INDEX(TREND(I2:I5;H2:H5;K2:K3);1;1). The mathematical reference is 17. - In B2 enter
=INDEX(TREND(I2:I5;H2:H5;K2:K3);1;2). The reference is 20.
Orientation matters: this implementation stores prediction results across one row even when new x is a column. The second INDEX call uses row 1, column 2. Do not change it to row 2, column 1 merely because K2:K3 is vertical.
The scalar formulas retrieve individual results from the returned array. They do not demonstrate automatic spilling or a tested keyboard shortcut for a multi-cell formula. If x is an instrument reading and y a calibrated quantity, predictions retain the y unit and the fitted slope has y-units per x-unit.
Advanced example: forcing the fit through zero
For the same data, Σxy = 110 and Σx² = 30. A zero-intercept fit therefore has slope 11/3. At x=5, =INDEX(TREND(I2:I5;H2:H5;K2:K3;0);1;1) predicts 55/3 ≈ 18.3333333333, rather than 17.
A process with a genuine baseline offset should not automatically be constrained to zero. Conversely, a physical law may justify a zero intercept. Decide from the model and measurement setup, then inspect residuals. A better-looking forecast alone is not a sound reason to choose one mode.
The exact sequence in the worked example has no residual noise, so it demonstrates arithmetic clearly. Real observations require attention to scatter, outliers and uncertainty. TREND returns fitted values, not a prediction interval, and extrapolation beyond observed x values can fail when the underlying relationship changes.
Input handling, errors and limitations
The source rejects unequal counts of known x and known y with a numeric error. Matching counts do not by themselves validate the pairing, units or interpretation of a two-dimensional layout. Keep a single clean paired series rather than assuming support for multiple predictors.
Known-x and new-x values are gathered through a helper that converts values rather than applying a uniform missing-observation policy. Do not assume text or blanks are harmlessly ignored along with their paired y values. Clean the pairs before fitting, and keep corresponding rows together when sorting or filtering.
Empty placeholders have separate source branches, including a generated 1-through-n sequence, but the output loop still depends on the supplied third argument’s element count. They are not equivalent to a verified omitted-input default. Avoid both omission and empty placeholders in this guide’s safe route.
Constant x makes an unconstrained slope undefined. Near-constant x, very large offsets, overflow and rounding can also impair numerical accuracy. The examples do not establish universal stability or an error contract for all singular datasets.
Related functions and compatibility
Version scope and references
Reviewed October 18, 2026. The relevant implementation file and shared numerical/conversion files were compared between official 25.04.2 and 26.08.2 source and are byte-identical. This establishes source equivalence for the inspected code, not identical behavior on every platform or a native test of 26.08.2. The earliest release containing TREND has not been established; these version numbers are not introduction dates.
Mathematical reference values above were calculated independently. The native results below were obtained in Calligra Sheets 25.04.2 on Linux, October 18, 2026; no native 26.08.2 execution is claimed. No unstated locale, import or array-entry behavior is implied.
Native verification in Calligra Sheets 25.04.2
These formulas were recalculated in the actual application and read back from its completed native-saved workbook. The image is an unmodified application screenshot. The earlier mathematical calculations remain independent references; this table records actual saved results.
The array checks retrieve individual elements with INDEX. They establish the listed values and orientation, not automatic spilling or a tested direct multi-cell array-entry shortcut.
Native H2:H5 contains 1,2,3,4, I2:I5 5,8,11,14, J2:J5 2,4,8,16, and K2:K3 5,6. L8 contains literal text text. Only the listed explicit-range formulas were tested.
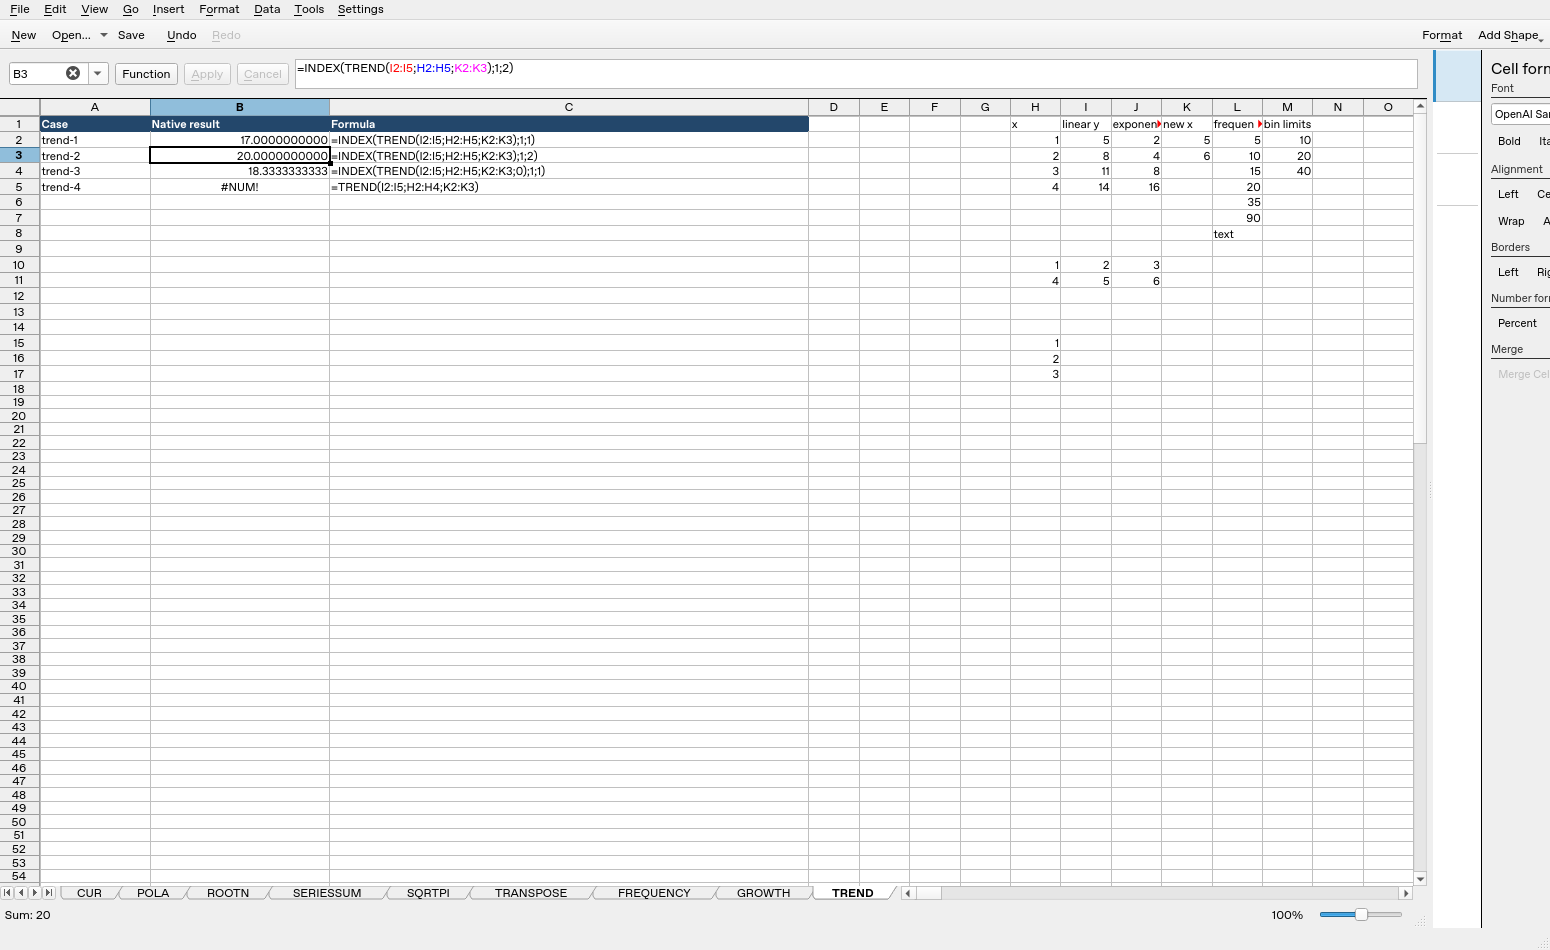
| Formula executed | Native saved result |
|---|---|
=INDEX(TREND(I2:I5;H2:H5;K2:K3);1;1) |
17 |
=INDEX(TREND(I2:I5;H2:H5;K2:K3);1;2) |
20 |
=INDEX(TREND(I2:I5;H2:H5;K2:K3;0);1;1) |
18.3333333333333 |
=TREND(I2:I5;H2:H4;K2:K3) |
#NUM! |
Display formatting may show fewer digits than the saved value. The tested cases do not establish every coercion, extreme magnitude or cross-application import behavior.