

CHITEST Function (Gnumeric)
Learn the CHITEST function in Gnumeric: Returns the chi square independence test.
Verification status: See the evidence and test scope described in this guide. How formula examples are checked
CHITEST compares observed counts with expected counts and returns an upper-tail probability. It does not return the chi-square statistic itself, and it does not construct the expected table for you. The expected counts must represent the null model you actually intend to test.
Syntax and degrees of freedom
=CHITEST(actual_range,theoretical_range)
Both arguments are required. actual_range holds observed counts; theoretical_range holds expected counts in corresponding positions. Gnumeric checks equal total cell counts before calculating. For clear reproducible work, use matching shapes as well: the degrees of freedom are derived from the observed range’s dimensions.
For an n-by-1 or 1-by-n observed range, degrees of freedom are n−1. For a genuine r-by-c table, both dimensions exceeding one, they are (r−1)(c−1). This supports independence or homogeneity testing when expected counts were calculated appropriately. Merely reshaping the same observations can change the test. The function has no argument to reduce degrees of freedom for extra fitted parameters; use a separately calculated statistic and an appropriate tail function when your statistical model requires a different value.
Reproducible three-category example
Enter the following counts:
| Row | A: observed | B: expected |
|---|---|---|
| 1 | 12 | 10 |
| 2 | 8 | 10 |
| 3 | 10 | 10 |
=CHITEST(A1:A3,B1:B3) has expected result approximately 0.670320046035639. The totals are both 30. Independently calculate the statistic as (12−10)²/10 + (8−10)²/10 + (10−10)²/10 = 0.8. There are 3−1 = 2 degrees of freedom. For two degrees of freedom the upper tail is exp(−0.8/2), yielding the stated result. This provides an arithmetic check independent of the spreadsheet’s CHITEST implementation.
At a preselected 0.05 significance level, that p-value does not reject the specified equal-probability model. It is not a 67% probability that the model is true, and failure to reject is not proof that the categories are equally likely.
Advanced application: build an independence table
For a two-way contingency table, calculate each expected cell as its row total × column total ÷ grand total. Keep the expected table in exactly the same row/column order as the observations, then pass the two ranges. A 2-by-3 table uses (2−1)(3−1) = 2 degrees of freedom. Do not include row totals, column totals or the grand total in either tested range: that would add dependent cells and change the dimensions.
Check whether the chi-square approximation is appropriate for your counts. Extremely sparse expected cells, non-independent observations, or percentages substituted for sample counts can invalidate the intended test even when the formula returns a number. A valid spreadsheet calculation does not establish a valid study design.
Errors and data-quality checks
In the inspected implementation, unequal total cell counts produce #N/A before other checks. A zero expected entry or no usable numeric pairs leads to #DIV/0!; negative expected entries lead to #NUM! when no earlier error takes precedence. Blank, text and Boolean values are ignored by paired numeric collection, so a returned value does not prove every cell was tested. Use complete numeric count tables and verify totals before interpreting the output.
For targeted checks, =CHITEST({1,2},{0,3}) is expected to return #DIV/0!, while =CHITEST({1,2},{-1,3}) is expected to return #NUM!. Avoid a one-cell test, whose inferred degrees of freedom are zero. Do not rely on this function to reject every statistically nonsensical observed count: validate nonnegative counts yourself.
Availability and evidence scope
The fn-stat module in the retained official Gnumeric 1.12.62 source registers this function. The official NEWS entry for Gnumeric 0.27 lists CHITEST among added functions, establishing its documented introduction. The last functioning release and historical runtime behavior were not exhaustively tested. NEWS also records a rectangular-range fix in 1.10.3. This is a desktop worksheet function, with no web-edition claim. The official source archive was retained October 13–14, 2026 and inspected again October 17. It was not newly downloaded during this review.
The worked results are independently calculated expectations. On October 17, 2026, Gnumeric ssconvert 1.12.57 under C.UTF-8 recalculated the primary fixture successfully. The primary p-value was 0.6703200460356393; the size-mismatch, zero-expected and negative-expected cases returned #N/A, #DIV/0! and #NUM!, respectively. XLSX export normalized CHITEST to _xlfn.CHISQ.TEST; the input fixture used CHITEST. Other optional-argument, statistical-diagnostic and edge-case statements are source-derived or mathematical rather than separately native-tested here. The selected primary example is also shown in the genuine Gnumeric 1.12.57 screenshot below. No Gnumeric 1.12.62 execution or broader GUI workflow is claimed. Formula examples use English names and comma separators; adapt separators to the workbook locale. Array results are not a promise of Excel-style automatic spilling. Use Gnumeric array entry for a suitably sized result area, or INDEX to inspect individual elements.
The source describes this name as the OpenFormula LEGACY.CHITEST function; that compatibility label does not certify identical behavior in every other spreadsheet.
Sources and related guides
- Official Gnumeric function catalog
- Pinned official statistical function help and implementation
- Pinned registration
- Official release history
- CHIDIST evaluates the upper tail when a statistic and chosen degrees of freedom are already available; CHIINV works in the inverse direction.
Native application screenshot
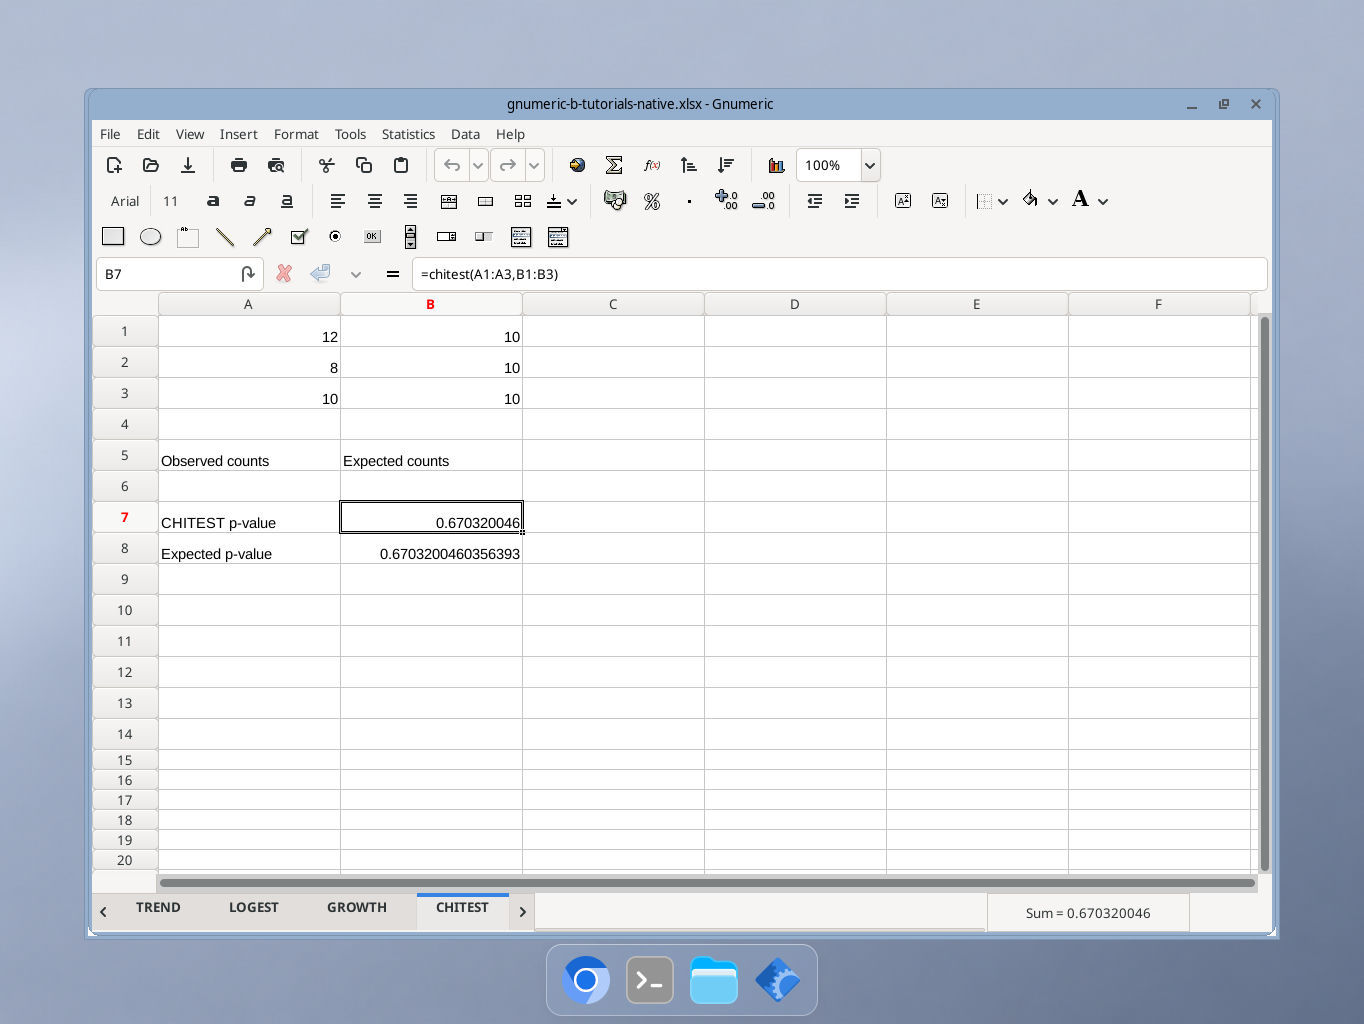
Gnumeric 1.12.57, captured October 17, 2026. Selected cell B7 shows the documented formula result 0.6703200460356393. The formula bar and synthetic inputs are visible; GUI locale was not independently recorded.