

Gnumeric · Statistical analysis · Beginner
Create a Score-Ranking Report with Ties in Gnumeric
Generate a separate Gnumeric Ranks and Percentiles report, select average or top ranks and avoid misidentifying tied observations.
Average/top ranking reports and ID companion formulas verified in Gnumeric 1.12.57 · Editorial standards
Use Statistics → Descriptive Statistics → Ranks And Percentiles to create a score report on a new sheet. Choose Average rank for statistical ranks or Top rank for competition placements. Keep the source IDs: the report’s Point column is not a reliable unique identifier when scores tie.
Requirements and evidence
Both tie settings and the ID-preserving companion formula were tested on 2026-10-16 in Gnumeric 1.12.57, Debian 13.6 Linux, English interface/C locale. The test used formula output on new sheets. Official 1.12.62 source and the 1.12 manual were also reviewed; 1.12.62 was not the tested runtime. Saved-file reopening, later score edits, appended rows, values-only output and blank/text inputs were not tested.
Download synthetic ranking scores and import into A1:B6:
| ID | Score |
|---|---|
| P01 | 90 |
| P02 | 70 |
| P03 | 90 |
| P04 | 100 |
| P05 | 50 |
Use only B1:B6 as the analysis input. The ID column must stay alongside the original scores, outside the numeric input. Confirm that =COUNT(B2:B6) returns 5. Blank or text scores are not part of this controlled example.
Produce the report without sorting the source
- Open Statistics → Descriptive Statistics → Ranks And Percentiles. These English menu labels are established by the 1.12.62 menu definitions; translation or older releases may differ.
- On Input, choose B1:B6, group by Columns, and select Labels because B1 contains Score. Use the range selector if the sheet name needs to be included.
- On Options, choose Average rank under Ties. Do not rely on an unspecified default.
- On Output, choose a new sheet. This protects the original ordering and avoids overwriting a populated output range. Choose formula output if you want source edits to recalculate; choose values for a snapshot.
- Run the analysis and inspect the report. In the 1.12.62 implementation the columns are Point, the input label Score, Rank, and Percentile Rank.
- Compare the scores and ranks with the independent expected table below. Check the original sheet still has P01 through P05 in its original order.
Verify ties and percentiles
| Score, largest first | Average rank | Top rank, if selected instead | Expected percentile rank |
|---|---|---|---|
| 100 | 1 | 1 | 100% |
| 90 | 2.5 | 2 | 50% |
| 90 | 2.5 | 2 | 50% |
| 70 | 4 | 4 | 25% |
| 50 | 5 | 5 | 0% |
The two 90s occupy positions 2 and 3, so their average rank is (2+3)/2 = 2.5. Top rank instead gives both position 2 and leaves position 3 unused. To compare, rerun the tool with Top rank into another new sheet; never overwrite the original report merely to try an option.
Percentile Rank is a separate calculation. The source uses PERCENTRANK with precision 10. For this example, its result for an observed score is the number of strictly smaller observations divided by 5-1: two scores are below 90, giving 2/4 = 50%. It is not 1 - average rank/5. Changing the tie-ranking option does not change this percentile expression.
These independently calculated values were also observed in the native Gnumeric 1.12.57 reports. Average and Top rank produced the same percentile values, as expected.
The Point column needs special care
For the five descending scores, the native 1.12.57 report showed Point values 4, 1, 1, 2, 5, matching the reviewed 1.12.62 implementation. These are positions within the score observations, excluding the heading, not sheet row numbers.
Both 90s point to the first matching observation because the tool uses an exact MATCH lookup for Point. Consequently, mapping Point 1 back to P01 twice would incorrectly erase P03 from an identity-based report. Do not use this column as a unique participant ID in tied data.
If you need a rank attached to each participant, keep the original ID/Score rows and calculate ranks beside them. For average descending rank in C2, fill down:
=RANK(B2,$B$2:$B$6)+(COUNTIF($B$2:$B$6,B2)-1)/2
Ranks in original ID order were 2.5, 4, 2.5, 1, 5 in the native test, matching the independent expectation. For competition placement use RANK alone. The separate analysis sheet remains useful as a distribution report, while this companion column preserves identity.
Native reports and source identity
Select a screenshot to open the full-size image.
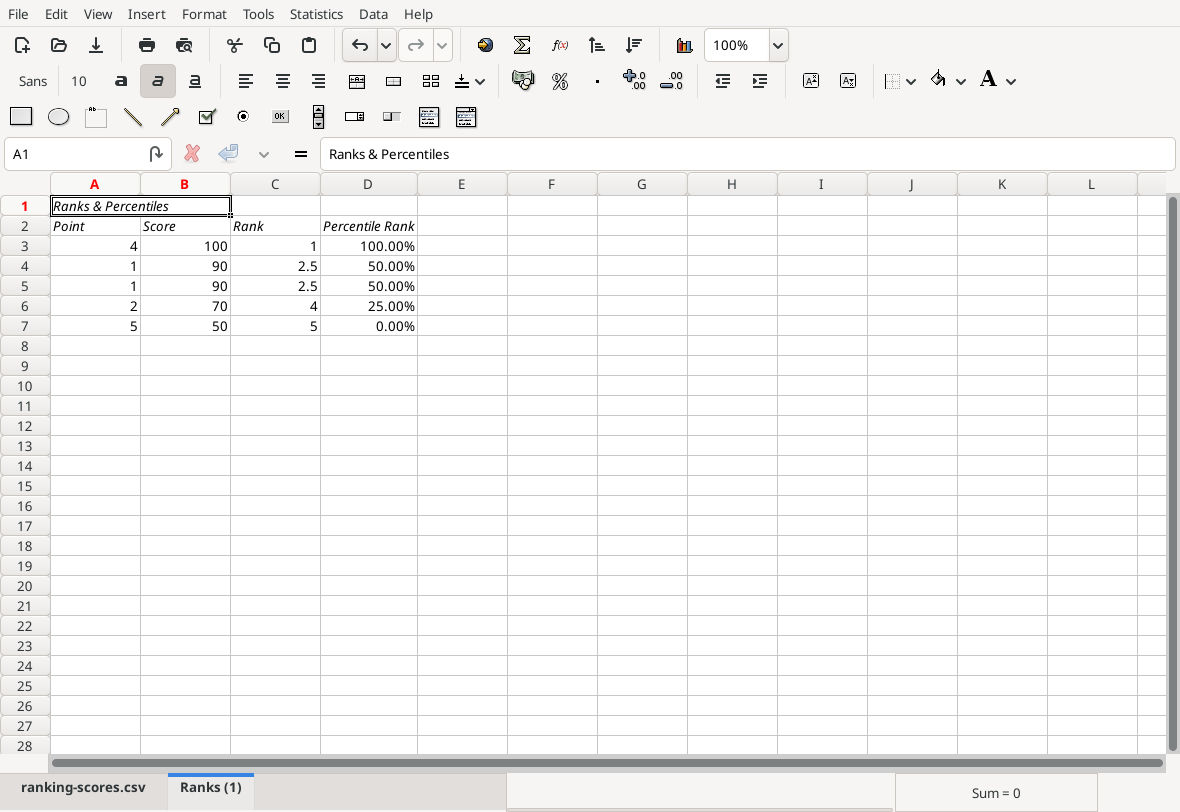
Actual average-rank output, 2026-10-16: tied scores share rank 2.5 and Point 1.
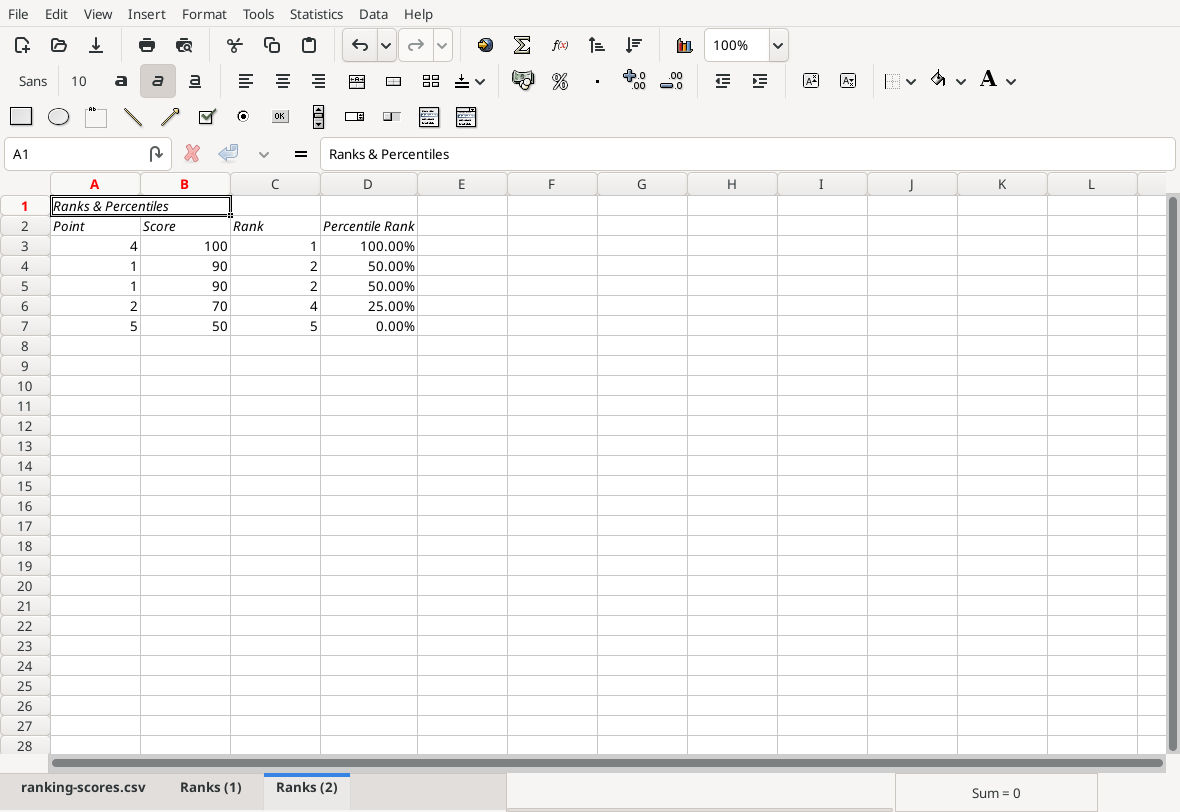
Actual Top rank output: both 90s receive rank 2; percentiles are unchanged.
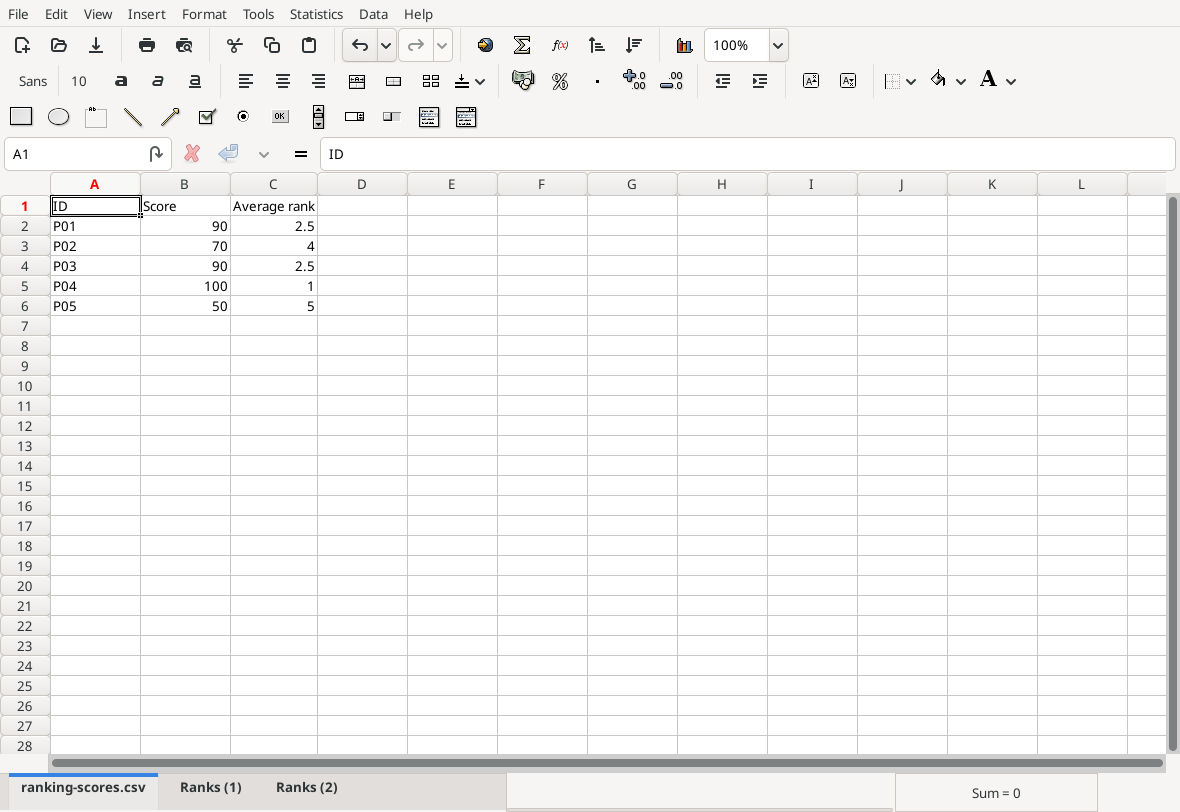
The companion formula keeps P01 and P03 as separate source records while giving both rank 2.5.
Download the saved native ranking workbook, containing the source and both reports. Saving was verified; reopening and recalculation after a score edit were not tested. The COUNT preflight above is recommended for readers but was not separately entered during this run.
Troubleshooting and safe limits
Check Labels if the heading appears to be treated as a score. If a result is missing, rerun into a new sheet rather than a small fixed output rectangle. Do not put a generated report over source data: the manual warns that existing output cells can be overwritten. Formula output updates references to its existing input; do not assume appended observations extend that input automatically. Recheck ranges and rerun when adding rows.
See RANK, COUNTIF and PERCENTRANK for the component functions.
Official references
- Gnumeric Rank and Percentile Tool, including the explanation of average ties.
- Analysis output options.
- Official Gnumeric 1.12.62 source:
src/dialogs/rank.ui,src/tools/analysis-tools.c, the menu definitions andplugins/fn-stat/functions.cestablish the tie option, four output columns, first-match Point limitation and percentile calculation.