

OpenOffice Calc · Pivot tables and analysis · Intermediate
Count Records by Month with OpenOffice Calc Pivot Tables
Create a monthly record count in Apache OpenOffice Calc, group dates by years and months, refresh the source and verify a sales-summary benchmark.
Create a pivot table with Date in Row Fields and RecordID in Data Fields using Count. Then select a date label in the result and group it by Years and Months. Including the year prevents January from different years becoming one undifferentiated monthly bucket.
Version scope and monthly source
Apache OpenOffice 4.1 documentation calls this feature Pivot Table; older documentation calls it DataPilot. These instructions use Data → Pivot Table → Create and English desktop controls, checked against the 4.1 guide and 4.1.16 Help. The monthly-count and sales-summary examples were tested in Apache OpenOffice Calc 4.1.17 on Linux x86_64 with English UI on October 16, 2026; see the exact test scope below.
Open the monthly-records CSV as comma-separated UTF-8. In Text Import, set Date to Date (YMD) and RecordID to Text before importing. The complete source occupies A1:B9:
| Date | RecordID |
|---|---|
| 2025-12-29 | R001 |
| 2026-01-03 | R002 |
| 2026-01-18 | R003 |
| 2026-02-02 | R004 |
| 2026-02-11 | R005 |
| 2026-02-26 | R006 |
| 2027-01-04 | R007 |
| 2027-01-20 | R008 |
Confirm =ISNUMBER(A2) is TRUE: a visible date string is not sufficient for calendar grouping. Every source record has a nonblank ID. Count here means count of nonempty record IDs, not a distinct-ID count; duplicated IDs would still contribute multiple records.
Create the ungrouped count
- Select A1:B9 explicitly, including both headings.
- Choose Data → Pivot Table → Create and use Current selection.
- Drag Date to Row Fields and RecordID to Data Fields.
- Double-click the RecordID data-field button and choose Count, not Count (Numbers only), because these IDs are text. Confirm that field setting. Do not leave the aggregation at Sum or assume the default is correct.
- Expand More if needed and use Results to to place the output in a clear area such as D1, with enough empty rows and columns for the summary. Ensure it cannot overwrite source data or notes.
- Confirm the layout. The ungrouped result should account for eight source rows.
The official pivot start guide and versioned Pivot Table dialog Help document creation, field placement, aggregation changes and output location.
Group the dates and verify the months
Click one date value in the pivot’s row labels, not its heading, total or a source cell. Choose Data → Group and Outline → Group. Use Intervals, select Months and Years, and clear unwanted units. Leave start/end automatic for this complete dataset, then confirm.
The expected year/month counts are:
| Year | Month | Records |
|---|---|---|
| 2025 | December | 1 |
| 2026 | January | 2 |
| 2026 | February | 3 |
| 2027 | January | 2 |
| Grand total | 8 |
The exact layout and month names may follow locale and pivot settings. Compare the year/month pairs and counts, not a promised output cell position. January 2026 and January 2027 must remain distinguishable. Official date-grouping guide.
Refresh and extend deliberately
Change R003’s source date from January 18 to February 18, 2026. Select a result cell and choose Data → Pivot Table → Refresh. Expected counts become January 2026 1, February 2026 4, with grand total still 8. Restore the original date and refresh again after the test.
For an expansion test, append 2027-02-05 and R009 in A10:B10, making sure A10 is a numeric date. Data outside the old A1:B9 range is not covered just because you refresh. Select A1:B10 and create a new pivot in a separate empty area, repeat the Count layout and Years/Months grouping, and compare it with the original. Expected new result: February 2027 has 1 record and the grand total is 9. Keep the original summary until the expanded one checks out. The official guide recommends recreating the pivot when data is typed outside its original source area. Updating or Refreshing Changed Values.
For a layout-only change to an existing result, right-click inside it and choose Edit Layout. Reopening the layout.
Keep the original sales-summary benchmark
The eight-row sales CSV is a separate exercise. Its complete records are:
| Region | Channel | Amount |
|---|---|---|
| North | Online | 120 |
| North | Retail | 80 |
| South | Online | 90 |
| South | Retail | 140 |
| North | Online | 60 |
| South | Online | 30 |
| North | Retail | 40 |
| South | Retail | 20 |
On a separate sheet, create a pivot with Region in Row Fields, Channel in Column Fields and Amount in Data Fields set to Sum. Expected North Online/Retail totals are 180/120, South totals 120/160. Region totals are 300/280, channel totals 300/280, and grand total 580. A count instead of a sum indicates an aggregation or source-type problem.
Troubleshooting
If calendar grouping is unavailable, check that source dates are numeric and that you selected one pivot date label. If counts are low, inspect blank IDs, filters and source boundaries. If a month appears under the wrong year, verify the imported dates and grouped units. Missing months need not appear as explicit zero rows; this exercise tests only months represented in the source.
Save the workbook as .ods to retain the pivot setup; CSV cannot do so. Use ISNUMBER for date/type checks and COUNT for a numeric-date source count.
Native example and test limits
Tested in Apache OpenOffice Calc 4.1.17, AOO4117m2, Build 9818, revision 49c05bc6fd, on Linux x86_64, with English UI and English (USA) defaults, on October 16, 2026. The monthly CSV was imported with Date (YMD) and text RecordID; ISNUMBER(A2) returned TRUE. Explicit Count aggregation and Months + Years grouping produced the expected 1/2/3/2 counts and total 8. The native grouped result left its numeric-column caption blank; the Count selection is shown separately below.
Changing R003 to February 18 and refreshing changed January/February 2026 to 1/4; restoring the source date and refreshing returned 2/3. After appending R009, a fresh pivot from A1:B10 at D14 included February 2027 with 1 and total 9. The original A1:B9 pivot at D1 stayed at 8, including after an explicit refresh following ODS close/reopen. This demonstrates a fixed source range rather than automatic expansion.
A separate native sales pivot used Region rows, Channel columns and Sum of Amount. It produced North 180/120/300, South 120/160/280, channel totals 300/280, and grand total 580. Both the monthly workbook and the separate sales workbook were saved as ODS, closed and reopened successfully.
Select a screenshot to open the full-size image.
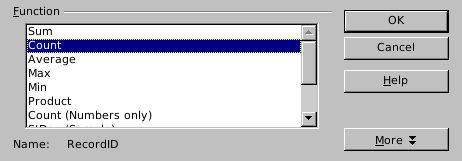
Native 4.1.17: choose the aggregation deliberately for text IDs.
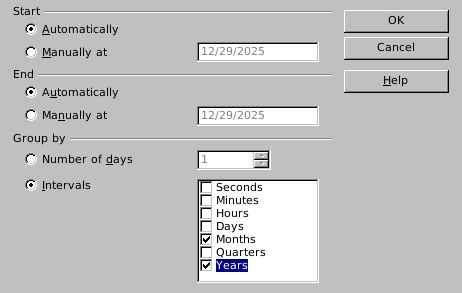
Native 4.1.17: grouping by both units keeps January in different years distinguishable.
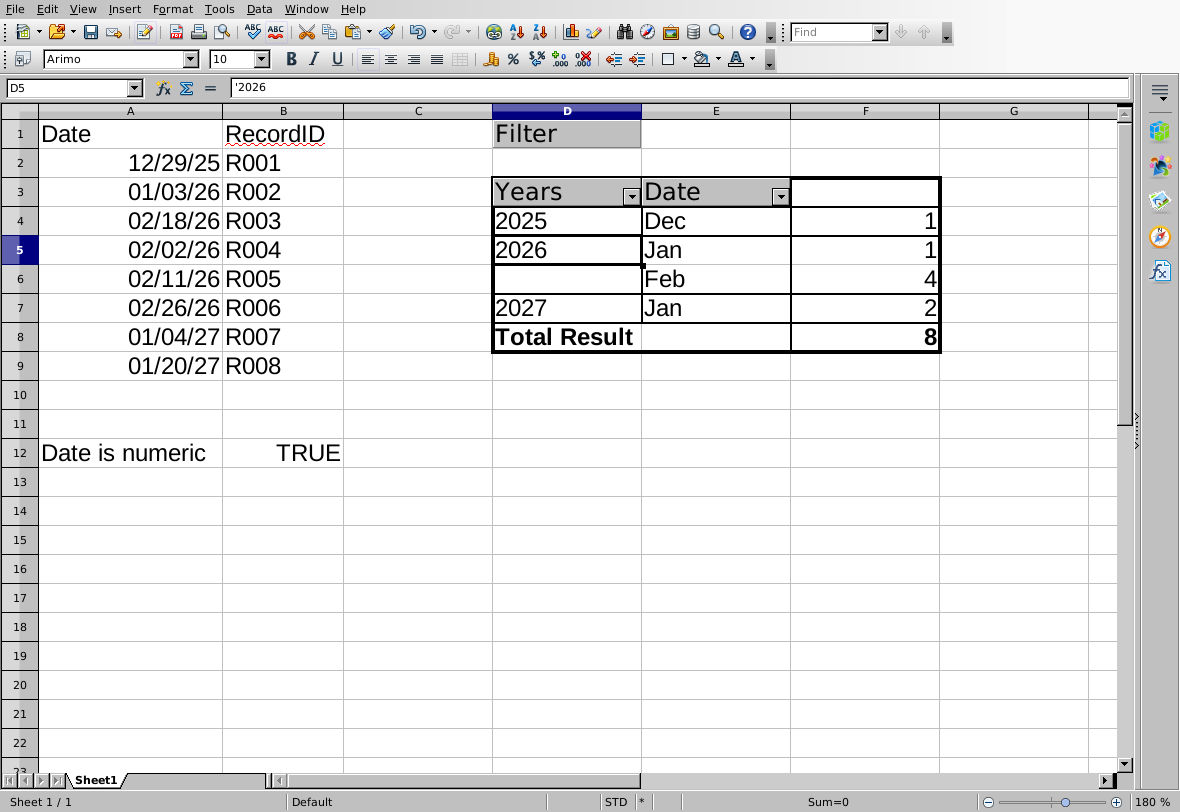
Native 4.1.17: the changed in-range source date updates the monthly buckets while total8 remains unchanged.
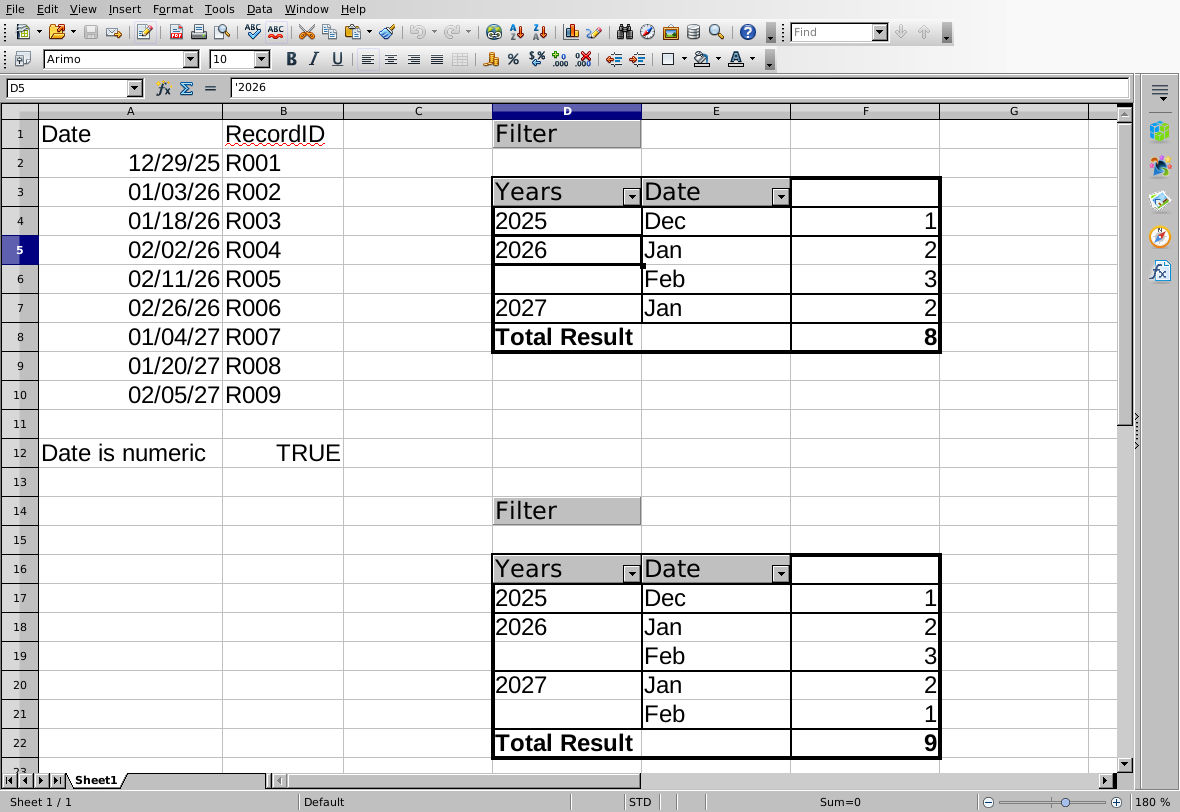
Native 4.1.17 after ODS reopen: the upper A1:B9 pivot excludes row10 even after Refresh; the lower fresh A1:B10 pivot includes it.
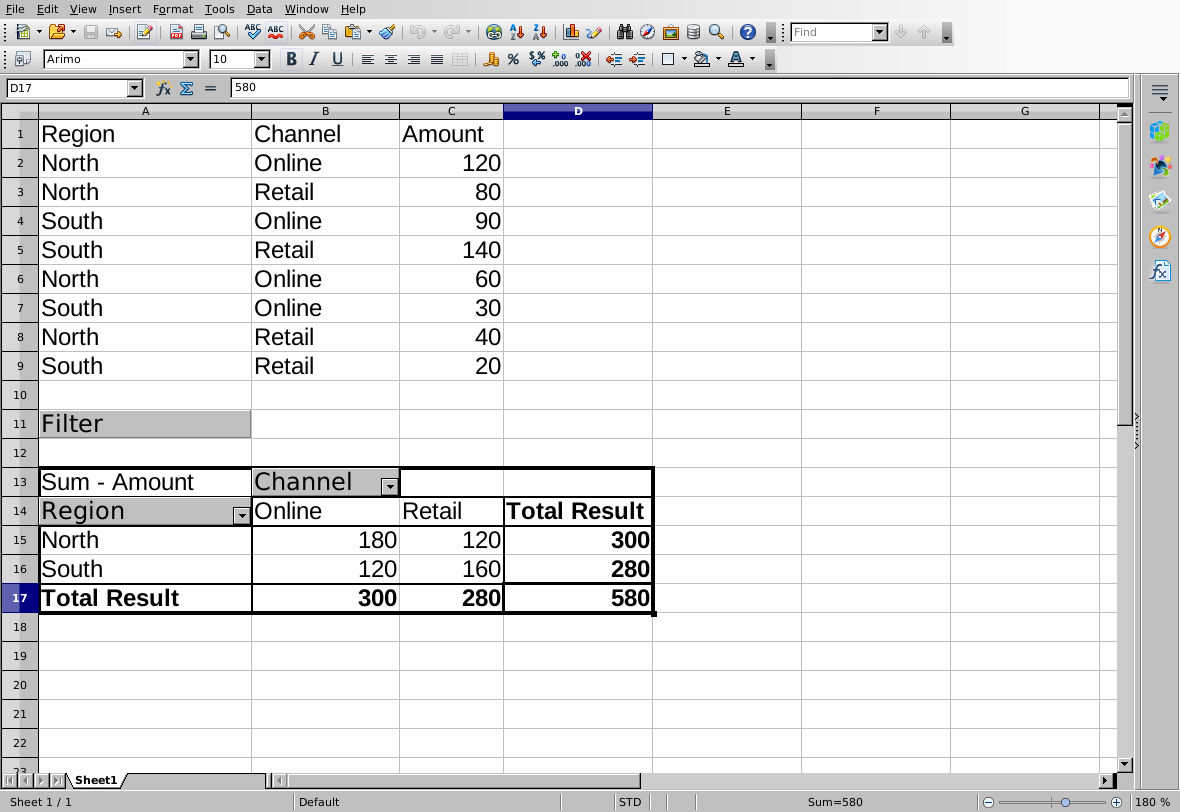
Native 4.1.17: the separate sales benchmark uses Sum, with all row, column and grand totals matching the independent calculation.
Evidence and limits: Independent date buckets and sales arithmetic were calculated separately from native execution. Screenshots are genuine, unmodified captures. The sample IDs are unique and nonblank; duplicate/blank IDs, missing dates, time zones, external sources, other platforms/locales and other applications were not tested. The expanded monthly summary was created fresh, not by editing an existing pivot source. Sales-source editing/refresh and a new-sheet output destination were not tested. Count is not a distinct-ID aggregation.