

GROWTH in FreeOffice PlanMaker: Syntax and Worked Examples
Fit exponential predictions with GROWTH, including implicit x values, new coordinates and the Constant=FALSE scale-one model.
Verification status: See the evidence and test scope described in this guide. How formula examples are checked
Quick answer
For x=0,1,2,3 and y=2,4,8,16, the exact exponential model is y=2×2^x. GROWTH predicts 32 at x=4 and 64 at x=5.
GROWTH returns fitted or predicted y values. It does not return the multiplier and scale coefficients themselves; LOGEST is the related coefficient function.
Syntax and defaults
=GROWTH(y_values [, x_values] [, New_x_values] [, Constant])
All y values must be positive; the official help documents #NUM! otherwise. If x_values is omitted, the function uses 1,2,3,… according to the number of supplied y values. If New_x_values is omitted, it evaluates at the known x values.
Constant TRUE or omitted estimates the multiplicative scale b. FALSE forces b=1 and adjusts the multiplier or multipliers. This is not the linear-regression convention of forcing an intercept to zero in original y units. In the model y=b×m^x, b=1 corresponds to a zero intercept after taking logarithms.
Step-by-step: an exact exponential curve
| Row | A: x | B: y | C: scale-one y |
|---|---|---|---|
| 2 | 0 | 2 | 1 |
| 3 | 1 | 4 | 2 |
| 4 | 2 | 8 | 4 |
| 5 | 3 | 16 | 8 |
Enter new x values 4 and 5 in E2:E3. The array expression =GROWTH(B2:B5,A2:A5,E2:E3) has independent expected predictions 32 and 64, in the order of the new coordinates.
The exact model can be checked without a numerical fitting library: each one-unit increase in x doubles y, and x=0 gives scale b=2. At x=4, 2×2⁴=32; at x=5, 2×2⁵=64.
The official array instructions call for a selected output range and Ctrl+Shift+Enter. For the vertical E2:E3 example, reserve two output rows. Native scalar INDEX readbacks below verify components, not that full-region keyboard workflow.
Defaults and forced scale
=INDEX(GROWTH(B2:B5),1,1) has independent expected value 2, and the fourth component is 16. Here omitted x values are 1,2,3,4; the equivalent exact model becomes y=2^x. Its fitted values at those coordinates are still the original four y values.
For C2:C5 with explicit A2:A5, =INDEX(GROWTH(C2:C5,A2:A5,E2:E3,FALSE),1,1) is expected to return 16. This dataset genuinely follows y=2^x with b=1. Forcing b=1 on arbitrary data would generally change the fitted multiplier and predictions; it is not a harmless display choice.
Advanced use: prediction versus extrapolation
The known coordinates stop at x=3. Predictions at x=4 and 5 are extrapolations. The exact demonstration makes their arithmetic transparent, but real data need not continue exponentially outside the measured interval.
A per-unit multiplier of two means 100% growth per x unit in this example. Changing x from days to months changes the meaning of the multiplier. Keep the units of x and y alongside the predictions, and do not interpret the fitted curve as evidence of a causal relationship.
For noisy positive observations, exponential regression is associated with a linear model in log space. An original-scale prediction should not automatically be described as an unbiased arithmetic mean without additional assumptions about errors and any retransformation adjustment. This guide’s exact data avoid that ambiguity.
Error and shape safeguards
The native zero-containing y range returned the documented #NUM! error, as detailed below. Keep known x and y observations aligned, and ensure new coordinates have the intended predictor structure. The brief help does not enumerate all errors for mismatched dimensions or text.
A successful scalar readback does not establish every array orientation or multiple-predictor case. The examples are bounded to a single predictor and vertical input/output coordinates.
Native scalar predictions and invalid y
Six scalar INDEX formulas were calculated in FreeOffice PlanMaker 2024 revision F1238.1005. New-coordinate predictions were 32 and 64; omitted-x/omitted-new-x controls returned 2 and 16 at the first and fourth known positions. The forced-scale-one control returned 16 at x=4. Using A2:A5 as y, which includes zero, returned #NUM!. All six expressions and fourteen numeric inputs survived native PMDX save and reopen. This evidence verifies the selected components and defaults, not native full-region array entry or every multi-predictor layout.
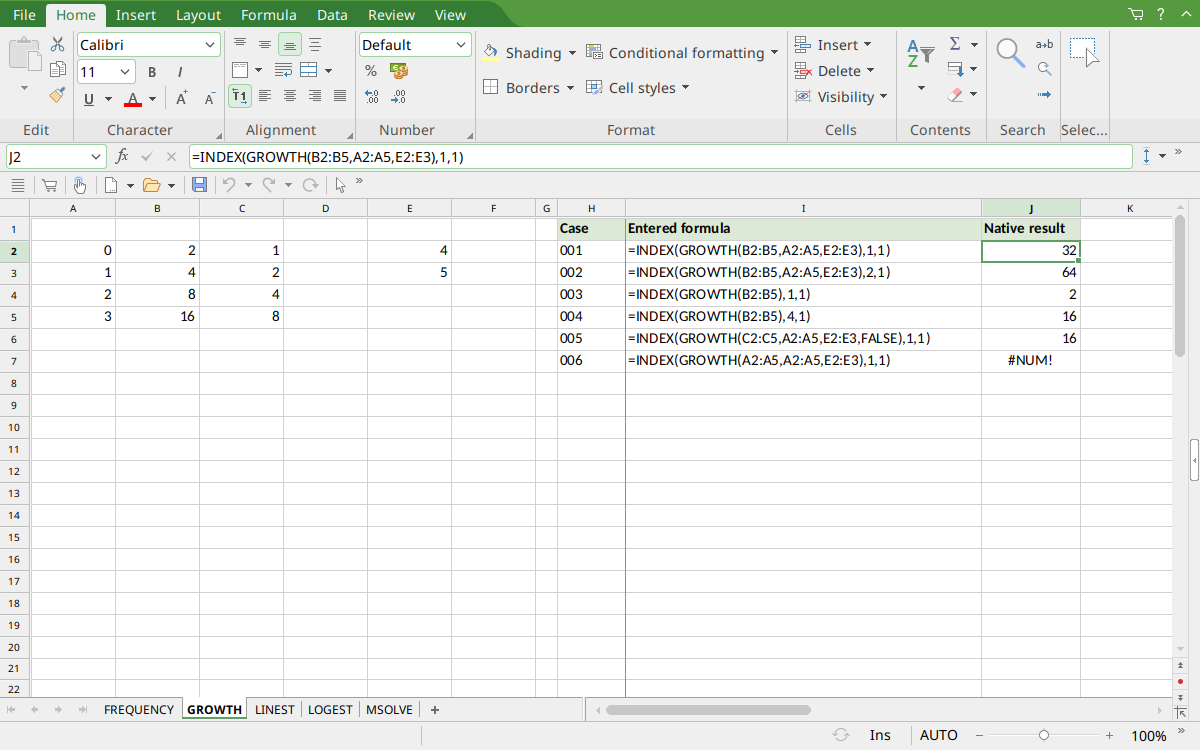
Selected J2 displays prediction 32; J3 shows 64. J4:J6 show the default and forced-scale controls 2,16,16, and J7 shows #NUM! for nonpositive y.
Version and verification scope
The official FreeOffice PlanMaker 2024 reference was checked October 18, 2026. The installed application is FreeOffice PlanMaker 2024 revision F1238.1005. The original introduction version is not established by this evidence; the current reference does not identify the function as deprecated or retired. No availability claim for a different edition or a 2026 release is implied.
The native section records scalar INDEX component readbacks or residual expressions calculated in revision F1238.1005 and preserved after PMDX save and reopen. It does not demonstrate multi-cell native array entry or automatic spilling. Official array workflow instructions are documentation-derived. Independent additional arithmetic and untested cases are identified separately. English formulas in this guide use commas; use the separators required by your formula settings.