

ONLYOFFICE PERCENTILE.EXC: Exclusive Percentiles and Sample-Size Limits
Compare exclusive and inclusive ONLYOFFICE percentiles with complete numeric examples and source-scoped finite-sample limits.
Verification status: See the evidence and test scope described in this guide. How formula examples are checked
PERCENTILE.EXC returns an interpolated percentile under an exclusive probability convention. Its results can differ from PERCENTILE.INC even when both formulas use the same complete numeric range. A small sample also limits which probabilities have positions between its first and last observations.
Availability and version history
- Introduced: The Desktop Editors changelog explicitly lists PERCENTILE.EXC as added in version 4.4.1. Docs and mobile introduction dates remain unknown.
- Availability: Documented in current ONLYOFFICE Spreadsheet Editor help; no final supported-version endpoint is established.
- Scope: Desktop and Docs release separately. The checked source revision does not establish identical behavior on every deployment, mobile client or older build.
- Checked: October 14, 2026, against the official PERCENTILE.EXC reference, vendor illustration and pinned source. Worked outputs were independently calculated; no native percentile test was performed.
Syntax and two different boundaries
PERCENTILE.EXC(array, k)
The official help specifies a numeric k strictly between 0 and 1 and a selected data range. Both arguments are supplied. The endpoints 0 and 1 are outside that documented probability domain.
The pinned official implementation adds a finite-sample check. For n numeric observations it uses one-based position h=(n+1)k, rejecting a position below 1 or above n. For the all-numeric model, that gives 1/(n+1)≤k≤n/(n+1). This is a source-scoped condition; the help’s shorter 0<k<1 statement alone does not describe it.
For example, eight observations give an upper interpolation bound of 8/9, approximately 0.888889. Although 0.9 is between 0 and 1, its position would be 8.1, beyond the eighth observation. Do not promise that every probability inside the help’s open interval will work for every sample size. No native invalid-input test or exact error-token claim is made here.
Reproduce the official midpoint example
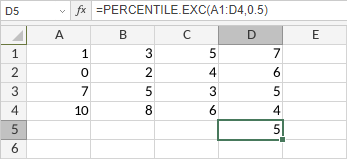
Create VendorExclusive. Enter this grid in A1:D4 without headings inside the selected range:
| Row | A | B | C | D |
|---|---|---|---|---|
| 1 | 1 | 3 | 5 | 7 |
| 2 | 0 | 2 | 4 | 6 |
| 3 | 7 | 5 | 3 | 5 |
| 4 | 10 | 8 | 6 | 4 |
Put =PERCENTILE.EXC(A1:D4,0.5) in D5. The vendor illustration shows 5. The source-backed position is 17×0.5=8.5, between two sorted values of 5. This example agrees with the inclusive midpoint but does not imply that the two conventions always agree.
Compare conventions on eight response times
Create ConventionCheck, reserving A1:H14. Put Minutes in A1 and enter 12,15,18,18,22,27,35,45 in A2:A9. Put Probability, Exclusive, Inclusive and Difference in C1:F1.
Enter the probabilities below in C2:C6. Put =PERCENTILE.EXC($A$2:$A$9,C2) in D2, =PERCENTILE.INC($A$2:$A$9,C2) in E2 and =D2-E2 in F2. Fill D2:F2 down through row 6.
| Row | C: k | Expected D | Expected E | Expected F |
|---|---|---|---|---|
| 2 | 0.125 | 12.375 | 14.625 | -2.25 |
| 3 | 0.25 | 15.75 | 17.25 | -1.5 |
| 4 | 0.5 | 20 | 20 | 0 |
| 5 | 0.75 | 33 | 29 | 4 |
| 6 | 0.875 | 43.75 | 36.25 | 7.5 |
For k=0.25, the exclusive position is 2.25, giving 15+0.25×(18−15)=15.75. The inclusive position is 2.75, giving 17.25. At k=0.75, the exclusive position is 6.75, so the value is 27+0.75×(35−27)=33.
Put =COUNT(A2:A9) in H2 for 8. Put =1/(H2+1) in H3 and =H2/(H2+1) in H4. The exact expected bounds are 1/9 and 8/9. These controls apply to this numeric fixture and the pinned interpolation branch; they do not validate mixed-type input sets.
Advanced: a new observation changes positions and bounds
Copy ConventionCheck as NineObservations and enter 60 in A10. Change D2 to =PERCENTILE.EXC($A$2:$A$10,C2) and E2 to =PERCENTILE.INC($A$2:$A$10,C2), then fill both through row 6. F2:F6 already refers to the correct D/E outputs.
Update H2 to =COUNT(A2:A10). It becomes 9, and H3/H4 become 0.1,0.9. The copied results are:
| Row | C: k | Expected D | Expected E | Expected F |
|---|---|---|---|---|
| 2 | 0.125 | 12.75 | 15 | -2.25 |
| 3 | 0.25 | 16.5 | 18 | -1.5 |
| 4 | 0.5 | 22 | 22 | 0 |
| 5 | 0.75 | 40 | 35 | 5 |
| 6 | 0.875 | 56.25 | 45 | 11.25 |
On this copy only, put 0.9 in H6 and =PERCENTILE.EXC(A2:A10,H6) in H7. Its source-backed mathematical expectation is 60: h=10×0.9=9 selects the ninth observation. The original eight-observation example did not have a position available for that probability.
Adding one value changes more than the maximum. It changes the sample count, interpolation positions, midpoint and admissible bounds. Keeping the old range A2:A9 would miss all of those intended changes.
Interpret the convention rather than guessing its effect
In these examples the exclusive lower quartile is lower, the upper quartile is higher and the midpoint agrees. Those are properties of the stated calculations, not a universal promise about every possible method called a percentile. The results can fall between actual observations and do not certify future probabilities.
Use PERCENTILE.INC for the inclusive convention, or PERCENTILE for its legacy implementation relationship. Decide on the convention before comparing reports from different programs or sample sizes.
The checked help and source do not establish native behavior for every empty, text, Boolean, error or imported-array case. Preserve repeated numeric observations and avoid silently inserting zero for missing measurements. COUNT checks this explicit numeric dataset; exact runtime errors, extreme precision and Docs/mobile parity remain separate questions.