

ONLYOFFICE PERCENTRANK: Relative Positions, Precision and Response-Time Examples
Use ONLYOFFICE PERCENTRANK and its PERCENTRANK.INC alias to compare relative ranks, precision settings and complete response-time examples.
Verification status: See the evidence and test scope described in this guide. How formula examples are checked
PERCENTRANK returns a value’s relative position within numeric data as a fraction. A result of 0.625 displays as 62.5% when formatted as a percentage. It is not an ordinal position such as fourth place, and it is not necessarily the fraction of records below the value.
Availability and version history
- Introduced: PERCENTRANK’s original introduction is unknown. The Desktop changelog adds its PERCENTRANK.INC alias in 4.4.1; Docs/mobile introduction dates remain unknown.
- Availability: Documented in current ONLYOFFICE Spreadsheet Editor help; no final supported-version endpoint is established.
- Scope: Desktop and Docs release separately. The checked source revision does not establish identical behavior on every deployment, mobile client or older build.
- Checked: October 14, 2026, against the official PERCENTRANK reference, vendor illustration and pinned source. Worked outputs were independently calculated; no native percentile-rank test was performed.
Syntax, optional precision and numeric inputs
PERCENTRANK(array, x, [significance])
The official reference requires a numeric data range and a numeric value x. The optional significance argument defaults to 3. Brackets indicate optional syntax; do not type them into the formula.
The help calls significance a number of significant digits. For the ordinary decimal results used here, the pinned official source cuts the decimal representation after the requested number of fractional digits rather than rounding it to nearest. This source-level behavior is separate from the cell’s display format. Scientific-notation and extreme-precision cases are outside these examples.
For distinct sorted observations, the source-backed inclusive model assigns the j-th observation (j−1)/(n−1). Between two observations, it interpolates the position according to the value’s distance between them. The examples use at least two numeric observations and keep x inside their range.
Reproduce the vendor’s grid and explicit precision
Create VendorRank, and put this complete grid in A1:D4 without headers inside it:
| Row | A | B | C | D |
|---|---|---|---|---|
| 1 | 1 | 3 | 5 | 7 |
| 2 | 0 | 2 | 4 | 6 |
| 3 | 7 | 5 | 3 | 5 |
| 4 | 10 | 8 | 6 | 4 |
D5 =PERCENTRANK(A1:D4,2,4) gives 0.1333 in the official illustration. After sorting, the unique value 2 is third among sixteen observations, giving an uncut fraction 2/15=0.133333…. Four fractional places produce the illustrated 0.1333.

In F2 enter =PERCENTRANK(A1:D4,2) for the source-backed default-precision result 0.133. F3 =PERCENTRANK(A1:D4,2,3) has the same expected result. These are additional calculated checks; the vendor image specifically shows the four-digit formula.
Rank observed and intermediate response times
Create ResponseRanks, reserving A1:H14. Put Minutes in A1 and enter 10,20,30,50,80 in A2:A6. Put Target minutes in C1 and Rank fraction in D1. Enter the target values below in C2:C10.
In D2 enter =PERCENTRANK($A$2:$A$6,C2,3) and fill through D10:
| Target C | Expected rank D | Percentage display |
|---|---|---|
| 10 | 0 | 0% |
| 15 | 0.125 | 12.5% |
| 20 | 0.25 | 25% |
| 25 | 0.375 | 37.5% |
| 30 | 0.5 | 50% |
| 40 | 0.625 | 62.5% |
| 50 | 0.75 | 75% |
| 65 | 0.875 | 87.5% |
| 80 | 1 | 100% |
Use G2 =COUNT(A2:A6) for 5, G3 =MIN(A2:A6) for 10, and G4 =MAX(A2:A6) for 80. These controls inspect the explicitly numeric fixture.
For target 40, the value is halfway from 30 to 50. Those observations have inclusive ranks 0.5 and 0.75. G6 =0.5+(40-30)/(50-30)*(0.75-0.5) gives 0.625, matching D7. No new record with value 40 is inserted into the sample by asking for its rank.
Advanced: change units while retaining relative positions
Copy ResponseRanks as ResponseSeconds. Replace A2:A6 with 600,1200,1800,3000,4800 and C2:C10 with 600,900,1200,1500,1800,2400,3000,3900,4800. Rename A1 and C1 to seconds. The existing D formulas return the same nine fractions because both the observations and targets were multiplied by 60.
G2 remains 5, while G3/G4 become 600/4800. Update G6 to =0.5+(2400-1800)/(3000-1800)*(0.75-0.5) for the same 0.625. Changing only the sample units and leaving the targets in minutes would ask a different, often out-of-range question.
PERCENTRANK.INC alias and version history
PERCENTRANK.INC(array, x, [significance]) is the separately documented inclusive name. Its official reference gives the same arguments and default of 3. In the checked calculation source, it directly inherits PERCENTRANK’s calculation rather than defining a different rank convention. This guide therefore covers both names together.
The Desktop Editors changelog explicitly lists PERCENTRANK.INC in version 4.4.1. PERCENTRANK’s original introduction remains unknown, and the Desktop entry does not establish either name’s Docs or mobile introduction. Both remain documented in current help; source inheritance is not a retirement notice.
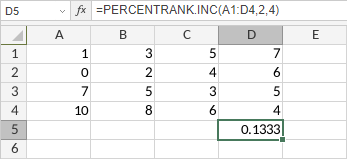
On VendorRank, enter =PERCENTRANK.INC(A1:D4,2,4) in F5. The separate INC illustration shows 0.1333 for this same complete grid. F5 therefore matches the legacy formula in D5.
Compare omitted, three-place and six-place results
Create PrecisionRanks, reserving A1:J12. Put Observation in A1 and enter 10,20,30,40,50,60,70 in A2:A8. Put Target, Default, Explicit 3, Explicit 6, Legacy 6 and Difference in C1:H1. Enter 20,25,30,50,60,70 in C2:C7.
Enter these formulas in row 2, then fill D2:H2 through row 7:
- D2:
=PERCENTRANK.INC($A$2:$A$8,C2) - E2:
=PERCENTRANK.INC($A$2:$A$8,C2,3) - F2:
=PERCENTRANK.INC($A$2:$A$8,C2,6) - G2:
=PERCENTRANK($A$2:$A$8,C2,6) - H2:
=F2-G2
| Target | Expected D and E | Expected F and G |
|---|---|---|
| 20 | 0.166 | 0.166666 |
| 25 | 0.25 | 0.25 |
| 30 | 0.333 | 0.333333 |
| 50 | 0.666 | 0.666666 |
| 60 | 0.833 | 0.833333 |
| 70 | 1 | 1 |
H2:H7 are 0. J2 =COUNT(A2:A8) is 7. These expected outputs use complete numeric input and the pinned source’s ordinary-decimal behavior, without claiming that every deployed build has been tested.
The inclusive mathematical position of target 20 is (2−1)/(7−1)=1/6. Target 25 is halfway between the second and third observations, giving 1.5/6=0.25. That exact terminating fraction does not lose information at either selected precision.
Percentage formatting cannot restore discarded digits
Copy D2 into J4 as a reference formula =D2, and format J4 as a percentage with four decimal places. The value 0.166 is displayed as 16.6000%. J5 =F2, using the six-place result and the same display format, shows 16.6666%.
The additional zeros in the first display do not recover the original 1/6. If a later calculation needs more precision, change the function’s significance argument appropriately before applying a display format. Neither finite result is the exact repeating fraction.
Move the maximum while holding a target fixed
Copy PrecisionRanks as ChangedMaximum and change only A8 from 70 to 700. Keep the target values in C unchanged. The first five rows retain their earlier outputs because the target positions through 60 still use unchanged lower observations.
For target 70 in row 7, D7/E7 now have the expected value 0.835, F7/G7 have 0.835937, and H7 remains zero. Seventy is no longer an observed maximum; it lies between 60 and 700.
The uncut position is (5+(70−60)/(700−60))/6 = 107/128 = 0.8359375. Enter =(5+(70-60)/(700-60))/6 in J7 for that mathematical control. Its six-place source-derived rank is 0.835937. Display rounding of the control can differ from the function’s digit-cutting step, which is why the full fraction is shown.
Interpret the fraction in context
Three of the five original observations are at or below 40 minutes: 60% of the records, compared with the interpolated rank 62.5%. Percent rank and an empirical count proportion use different calculations.
For response time, a larger value can represent a slower response. A larger percent rank is therefore not automatically better performance. Nor does this sample rank give the probability of a future response exceeding a service target.
The PERCENTRANK.INC alias above shares the checked inclusive implementation. PERCENTRANK.EXC uses a different position convention. PERCENTILE.INC goes in the other direction, taking a percentile fraction and returning a value, subject to precision and data assumptions.
Boundaries and troubleshooting
The pinned helper rejects x outside the observed range and significance below 1. It has separate branches for ties and a singleton sample. These exercises do not establish exact native error tokens, fractional precision settings, all-equal samples or every tie policy.
Keep headers, missing values and other types separate from this complete numeric model. Formatting an already shortened result with more decimal places cannot restore removed digits. COUNT helps check this fixture’s size without proving how an arbitrary mixed range will be processed.