

ONLYOFFICE STDEVPA: Population Spread with Text and Logical Values
Calculate population standard deviation in ONLYOFFICE with typed desktop examples, Boolean flags, complete worksheets and the official illustration.
Verification status: Ten scalar mixed-input cases checked in ONLYOFFICE Desktop Editors Community 10.0.0.169 on Linux x64; additional worksheet and illustration results independently calculated. Docs, mobile and other builds untested. How formula examples are checked
STDEVPA measures the standard deviation of an entire population while including text and logical values under its documented conversion rules. Text and FALSE contribute zero, TRUE contributes one, and truly empty cells are ignored.
In the exact desktop tests below, numeric-looking text also contributed zero. For a range containing numeric 4 and 6 plus the text pending, the observed result was approximately 2.4944382578, rather than the numeric-only population standard deviation of 1.
Availability and version history
- Introduced: The first introduction release and date are not established by the checked sources.
- Availability: Currently documented in ONLYOFFICE’s rolling Spreadsheet Editor help; no final supported-version endpoint is established.
- Scope: Ten scalar cases were executed in Desktop Editors Community 10.0.0.169 on Linux x64. Docs, other desktop builds and mobile clients were not tested.
- Checked: October 14, 2026, against the official STDEVPA reference, source code and saved native results. Additional worksheet and illustration reconstructions were independently calculated.
Syntax
STDEVPA(value1, [value2], ...)
The official entry documents one leading value argument and optional further arguments, up to 255 values. A range can supply multiple observations. This argument limit is not a claim that a range is limited to 255 cells. Use the separator accepted by your spreadsheet locale; the formulas below follow the English help’s comma notation.
Input handling and the population denominator
The official help says text and FALSE contribute zero, TRUE contributes one, and empty cells are ignored. The pinned implementation explicitly maps strings to zero and uses the population denominator n inside the square root.
The native cases below confirm those outcomes for ordinary text, the exact numeric string 2, logical values, a true empty reference and a formula returning empty text. A formula result of "" is text, so it is not the same tested input as a genuinely empty cell. The source revision is separately scoped and is not asserted to identify every shipped build.
Reproduce the ten build-scoped cases
Create a sheet named TypedDispersion, leaving space through column J and row 16. Enter the following inputs in column B. Labels can go in A; put outputs in G so no formula overwrites an input.
| Cell | Entry | Intended stored type |
|---|---|---|
| B6 | 4 |
Number |
| B7 | 6 |
Number |
| B8 | pending |
Text |
| B9 | =TRUE() |
Logical TRUE |
| B10 | =FALSE() |
Logical FALSE |
| B11 | Leave genuinely empty | No stored value |
| B12 | Enter 2 after setting the cell to Text |
Text containing 2 |
| B13 | 0 |
Number |
| B14 | ="" |
Formula returning empty text |
Do not enter quote characters around the text in B8 or B12. If B12 is converted to a numeric cell during import, it is no longer the same test. The native fixture’s input types were checked from the saved workbook, not inferred from appearance.
The following results were observed after an explicit workbook recalculation in Desktop Editors Community 10.0.0.169, Linux x64 and verified in its saved output. Displayed decimals are rounded to ten places.
| Output cell | Formula | Observed result | Comparison |
|---|---|---|---|
| G6 | =STDEVPA(B6:B7) |
1.0000000000 | Numeric baseline |
| G7 | =STDEVPA(B6:B8) |
2.4944382578 | Ordinary text in a range |
| G8 | =STDEVPA(B6:B10) |
2.4000000000 | Text and Boolean values |
| G9 | =STDEVPA(B6:B7,B11) |
1.0000000000 | Explicit empty reference |
| G10 | =STDEVPA(B6:B7,B12) |
2.4944382578 | Numeric text reference |
| G11 | =STDEVPA(4,6,"2") |
2.4944382578 | Numeric text literal |
| G12 | =STDEVPA(4,6,"pending") |
2.4944382578 | Ordinary text literal |
| G13 | =STDEVPA(B6:B7,B13) |
2.4944382578 | Actual numeric zero |
| G14 | =STDEVPA(B6:B7,B14) |
2.4944382578 | Formula-produced empty text |
| G15 | =STDEVPA(B6:B11) |
2.4000000000 | Mixed range including a blank |
The exact numeric string 2 contributes zero in both the reference and literal tests, just like ordinary text. The true empty-cell reference is excluded, while B14’s empty-text formula contributes zero. Consequently, the broad mixed range in G15 agrees with G8. These observations do not establish every imported text grammar, array-constant or empty-set result.
Check the mapped population and a Boolean example
G8 corresponds to the five numbers 4,6,0,1,0. Their mean is 2.2, and their squared-deviation total is 28.8. Dividing by five gives variance 5.76; its square root is 2.4.
For an independently calculated Boolean example, create FlagPopulation. Put =TRUE() in A2:A4 and =FALSE() in A5. In C2 enter =STDEVPA(A2:A5) for approximately 0.4330127019. In C3 enter =VARPA(A2:A5) for 0.1875. In C5 enter =AVERAGEA(A2:A5) for 0.75. In C4 enter =SQRT(C5*(1-C5)) for the same standard deviation: three out of four flags are TRUE, so the zero/one population has p=0.75.
Copy the sheet to AllFlagsTrue and change A5 to =TRUE(). C5 becomes 1, and C2:C4 become 0. The mean-based formula now follows the changed flags instead of retaining a fixed 0.75 assumption.
The all-TRUE result means the four flags agree. It does not establish completeness, accuracy or absence of future variation. These flag worksheets are independent model examples beyond the ten native probes above.
Reconstruct the official illustration
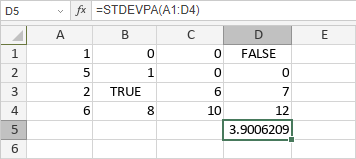
On a separate VendorGrid sheet, enter this 4-by-4 grid in A1:D4. Numeric entries are numbers, text is ordinary text, and the TRUE/FALSE entries are formulas producing logical values.
| Row | A | B | C | D |
|---|---|---|---|---|
| 1 | 1 |
0 |
0 |
=FALSE() |
| 2 | 5 |
1 |
0 |
0 |
| 3 | 2 |
=TRUE() |
6 |
7 |
| 4 | 6 |
8 |
10 |
12 |
In F2 enter =STDEVPA(A1:D4). The independently reconstructed result is approximately 3.9006209442, matching the precision shown in the vendor illustration. This entire illustration was not part of the native ten-case fixture. Its displayed values do not, on their own, prove the original screenshot workbook’s stored types.
Limits and related functions
The examples do not establish exact errors for empty datasets, error cells, huge magnitudes or malformed arguments.
AVERAGEA supplies the zero/one mean in the flag example. STDEV.P has a separately documented numeric-oriented contract. STDEVA calculates sample standard deviation; VARPA calculates population variance.