ONLYOFFICE VARPA: Population Variance, Mixed Inputs and Squared Units
Calculate population variance in ONLYOFFICE, verify text and logical conversions, and explain squared units and repeated-record effects with complete examples.
Verification status: Ten scalar mixed-input cases checked in ONLYOFFICE Desktop Editors Community 10.0.0.169 on Linux x64; additional worksheet and illustration results independently calculated. Docs, mobile and other builds untested. How formula examples are checked
VARPA calculates population variance, including text as zero and TRUE/FALSE as one/zero while ignoring truly empty cells. Use it when that inclusion rule fits the complete population you intend to describe.
The tested numeric values 4 and 6 have population variance 1. Adding the text pending changes it to approximately 6.2222222222: a zero-valued text observation is different from an absent observation.
Availability and version history
- Introduced: The first introduction release and date are not established by the checked sources.
- Availability: Currently documented in ONLYOFFICE’s rolling Spreadsheet Editor help; no final supported-version endpoint is established.
- Scope: Ten scalar cases were executed in Desktop Editors Community 10.0.0.169 on Linux x64. Docs, other desktop builds and mobile clients were not tested.
- Checked: October 14, 2026, against the official VARPA reference, source code and saved native results. Additional worksheet and illustration reconstructions were independently calculated.
Syntax
VARPA(value1, [value2], ...)
The official entry documents one leading value argument and optional further arguments, up to 255 values. A range can supply multiple observations. This argument limit is not a claim that a range is limited to 255 cells. Use the separator accepted by your spreadsheet locale; the formulas below follow the English help’s comma notation.
Input handling and the population denominator
The official help specifies population variance, text/FALSE as zero, TRUE as one and empty cells ignored. The pinned implementation divides the squared-deviation total by n. The tested scalar/reference cases below agree for their explicit inputs.
Population variance describes the population you choose. A complete list of this week’s readings can be a population for describing this week and still be a sample for a question about the wider process. Changing the denominator does not decide which interpretation is appropriate.
Reproduce the ten build-scoped cases
Create a sheet named TypedDispersion, leaving space through column J and row 16. Enter the following inputs in column B. Labels can go in A; put outputs in G so no formula overwrites an input.
| Cell | Entry | Intended stored type |
|---|---|---|
| B6 | 4 |
Number |
| B7 | 6 |
Number |
| B8 | pending |
Text |
| B9 | =TRUE() |
Logical TRUE |
| B10 | =FALSE() |
Logical FALSE |
| B11 | Leave genuinely empty | No stored value |
| B12 | Enter 2 after setting the cell to Text |
Text containing 2 |
| B13 | 0 |
Number |
| B14 | ="" |
Formula returning empty text |
Do not enter quote characters around the text in B8 or B12. If B12 is converted to a numeric cell during import, it is no longer the same test. The native fixture’s input types were checked from the saved workbook, not inferred from appearance.
The following results were observed after an explicit workbook recalculation in Desktop Editors Community 10.0.0.169, Linux x64 and verified in its saved output. Displayed decimals are rounded to ten places.
| Output cell | Formula | Observed result | Comparison |
|---|---|---|---|
| G6 | =VARPA(B6:B7) |
1.0000000000 | Numeric baseline |
| G7 | =VARPA(B6:B8) |
6.2222222222 | Ordinary text in a range |
| G8 | =VARPA(B6:B10) |
5.7600000000 | Text and Boolean values |
| G9 | =VARPA(B6:B7,B11) |
1.0000000000 | Explicit empty reference |
| G10 | =VARPA(B6:B7,B12) |
6.2222222222 | Numeric text reference |
| G11 | =VARPA(4,6,"2") |
6.2222222222 | Numeric text literal |
| G12 | =VARPA(4,6,"pending") |
6.2222222222 | Ordinary text literal |
| G13 | =VARPA(B6:B7,B13) |
6.2222222222 | Actual numeric zero |
| G14 | =VARPA(B6:B7,B14) |
6.2222222222 | Formula-produced empty text |
| G15 | =VARPA(B6:B11) |
5.7600000000 | Mixed range including a blank |
The exact numeric string 2 contributes zero in both the reference and literal tests, just like ordinary text. The true empty-cell reference is excluded, while B14’s empty-text formula contributes zero. Consequently, the broad mixed range in G15 agrees with G8. These observations do not establish every imported text grammar, array-constant or empty-set result.
Reconstruct the mixed population
The G8 result uses 4,6,0,1,0, with mean 2.2 and squared-deviation total 28.8. Population variance is 28.8/5 = 5.76. Its square root is 2.4, expressed in the original measurement units if all included values have a meaningful common unit.
Advanced: squared units and repeated records
Create UnitScale, entering 20,40,60 millimetres in A2:A4. In B2 enter =A2/10 and fill to B4 to obtain 2,4,6 centimetres.
| Cell | Formula | Independently expected result |
|---|---|---|
| D2 | =VARPA(A2:A4) |
266.6666666667 |
| D3 | =VARPA(B2:B4) |
2.6666666667 |
| D4 | =D2/D3 |
100 |
| D5 | =STDEVPA(B2:B4) |
1.6329931619 |
Dividing measurements by ten divides variance by one hundred. D2 is in square millimetres and D3 in square centimetres; D5 is in centimetres. A change of units is not a change in the underlying pattern.
For a separate repetition control, enter 2,4,6,2,4,6 in F2:F7. In H2 enter =VARPA(F2:F7) for 2.6666666667, unchanged by equal duplication. In H3 use =VARA(B2:B4) for 4, and in H4 use =VARA(F2:F7) for 3.2.
The population count and squared-deviation total both double, so their ratio is unchanged. The sample denominator changes from two to five, explaining the different sample variances. Duplicated records do not provide independent new information, even when a formula returns a plausible result. These numerical controls were calculated independently, beyond the ten native probes above.
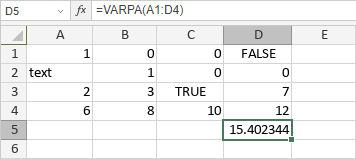
Reconstruct the official illustration
On a separate VendorGrid sheet, enter this 4-by-4 grid in A1:D4. Numeric entries are numbers, text is ordinary text, and the TRUE/FALSE entries are formulas producing logical values.
| Row | A | B | C | D |
|---|---|---|---|---|
| 1 | 1 |
0 |
0 |
=FALSE() |
| 2 | text |
1 |
0 |
0 |
| 3 | 2 |
3 |
=TRUE() |
7 |
| 4 | 6 |
8 |
10 |
12 |
In F2 enter =VARPA(A1:D4). The independently reconstructed result is approximately 15.4023437500, matching the precision shown in the vendor illustration. This entire illustration was not part of the native ten-case fixture. Its displayed values do not, on their own, prove the original screenshot workbook’s stored types.