

T.TEST in FreeOffice PlanMaker: Syntax and Worked Examples
Compare paired or independent samples with T.TEST and TTEST, choosing tails and variance assumptions while distinguishing p-values from statistics.
Verification status: See the evidence and test scope described in this guide. How formula examples are checked
Quick answer
T.TEST compares two numeric samples using the specified t-test model. =T.TEST(A2:A5,B2:B5,2,1) requests a two-tailed paired test. The documented legacy spelling TTEST has the same four-argument contract.
A test result must be interpreted with the sample design, tails and test type. It is not the difference between sample means, and a p-value is not the probability that a hypothesis is true.
Syntax and model selection
=T.TEST(Array1, Array2, Tails, Type)
=TTEST(Array1, Array2, Tails, Type)
All four arguments are required. The official help defines Tails=1 as one-tailed and Tails=2 as two-tailed. Type selects:
| Type | Model | Design requirement |
|---|---|---|
| 1 | Paired samples | Each row is a meaningful matched pair |
| 2 | Independent samples, equal variances | Independent groups and an appropriate common-variance model |
| 3 | Independent samples, different variances | Independent groups using unequal-variance standard errors |
The formula does not decide which design generated the data. Pairing is not justified merely because two columns have the same number of cells. For paired inference, the distribution of the differences matters; for independent tests, assumptions concern the independent observations and reference model. These small examples illustrate arithmetic, not evidence that a real study satisfies those assumptions.
Worked example: preserve the pairs
Enter these fictional measurements:
| Row | A: first measurement | B: second measurement |
|---|---|---|
| 2 | 2 | 1 |
| 3 | 4 | 2 |
| 4 | 6 | 4 |
| 5 | 8 | 5 |
The paired differences are 1,2,2,3. Their mean is 2, sample variance is 2/3 and standard error is sqrt((2/3)/4)=sqrt(1/6). The independently calculated paired t statistic is sqrt(24), approximately 4.898979486, with three degrees of freedom.
Enter =T.TEST(A2:A5,B2:B5,2,1) and compare =TTEST(A2:A5,B2:B5,2,1). The independent two-tailed probability is approximately 0.0162766035. That probability and the statistic 4.898979486 are different outputs; the native section identifies the observed function result.
Advanced comparison: change the design, not just the switch
The sample means are 5 and 3. Sample variances are 20/3 and 10/3. If these were genuinely independent groups, the equal-variance standard error would be sqrt(2.5), with t=2/sqrt(2.5) and six degrees of freedom.
Type 3 uses the same standard error for these equal sample sizes but a Welch–Satterthwaite degree count of 5.4, rather than six. Thus changing Type can change the p-value even when the numeric t statistic agrees. This does not make either model a preferred choice solely because its result is smaller.
For a paired one-tail arithmetic control, =T.TEST(A2:A5,B2:B5,1,1) is compared with half the two-tail probability. Reversing the samples gave the same native one-tail value, as detailed below. The brief official help does not specify a signed alternative, so do not assume the function alone encodes a prespecified directional hypothesis.
Input and interpretation safeguards
Keep each matched pair on the same row. Do not sort one column independently. Unequal paired lengths and malformed selectors need explicit validation; the official page does not enumerate every error token, blank-handling rule or text conversion.
The test does not report an effect size, confidence interval or practical importance. Retain the sample means, difference, sample sizes and design alongside the probability. A large p-value does not prove equality, and a small p-value does not by itself establish a causal or practically important effect.
Legacy spelling and compatibility
The TTEST page describes T.TEST as an identical newer function. Both spellings are included in the paired native controls. The modern help states Excel 2010-or-later support; it does not establish the PlanMaker introduction release or demonstrate an Excel export roundtrip.
Native p-values and tail-direction observation
Nine formulas were calculated in FreeOffice PlanMaker 2024 revision F1238.1005 using the eight numeric inputs shown above. Both spellings returned 0.016276603452204 for the paired two-tail test, 0.252810113301104 for independent equal variances and 0.257744433599885 for unequal variances. These are probabilities, not the corresponding t statistics. The paired one-tail result was 0.008138301726102 in both the original and reversed sample order. Thus this tested one-tail output did not encode the sign of the mean difference; do not treat it automatically as a directional p-value for a chosen alternative. Unequal paired lengths returned #N/A. All nine formulas and inputs survived native PMDX save and reopen.
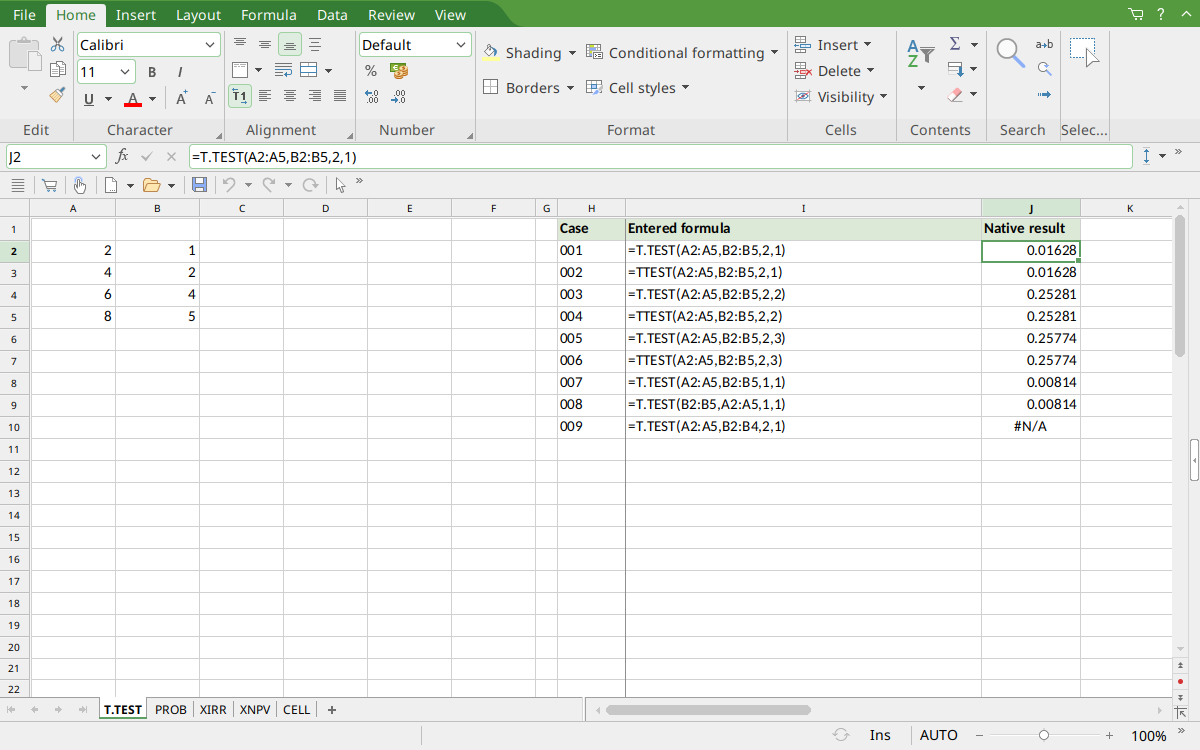
Selected J2 displays paired probability 0.01628. J4:J5 show 0.25281, J6:J7 show 0.25774, J8:J9 show 0.00814 in both sample orders, and J10 shows #N/A.
Version and verification scope
The official FreeOffice PlanMaker 2024 reference was checked October 18, 2026. The installed application is FreeOffice PlanMaker 2024 revision F1238.1005. The original introduction version is not established by this evidence; the current reference does not identify the function as deprecated or retired. No availability claim for a different edition or a 2026 release is implied.
The native section identifies the exact tested formulas and observed values from revision F1238.1005 after native PMDX save and reopen. Independent calculations, documented requirements and observed limitations are distinguished. Extra model arithmetic is not an additional native case unless identified. Compatibility notes are vendor guidance, not an Excel-export test. English formulas in this guide use commas; use the separators required by your formula settings.