

ONLYOFFICE QUARTILE.EXC: Exclusive Quartiles and Sample-Size Effects
Compare exclusive and inclusive ONLYOFFICE quartiles, reproduce the official grid and see how adding an observation changes cutoffs.
Verification status: See the evidence and test scope described in this guide. How formula examples are checked
QUARTILE.EXC returns the lower quartile, median or upper quartile using the exclusive percentile convention. Its documented selectors are 1, 2 and 3. Selectors 0 and 4 are not minimum/maximum shortcuts for this function.
Availability and version history
- Introduced: The original introduction release and date are not established by the checked references; related percentile release dates are not assigned to this function.
- Availability: Documented in current ONLYOFFICE Spreadsheet Editor help; no final supported-version endpoint is established.
- Scope: Desktop and Docs release separately. The checked source revision does not establish identical behavior on every deployment, mobile client or older build.
- Checked: October 14, 2026, against the official QUARTILE.EXC reference, vendor illustration and pinned source. Worked outputs were independently calculated; no native quartile test was performed.
Syntax and the difference from inclusive quartiles
QUARTILE.EXC(array, quart)
The official reference takes a data range and a numeric selector: 1 for the 25th percentile, 2 for the 50th and 3 for the 75th. Supply both arguments.
For the complete numeric samples below, the pinned official source uses the median for selector 2 and exclusive percentile interpolation for selectors 1 and 3. The corresponding one-based position is h=(n+1)×quart/4. An integer position selects an observation; a fractional one interpolates between its neighbors.
For example, with eight observations, the lower position is 2.25 and the upper is 6.75. Inclusive quartiles instead use 2.75 and 6.25. The median agrees, while the two outer quartiles can differ.
Reproduce the vendor’s median example
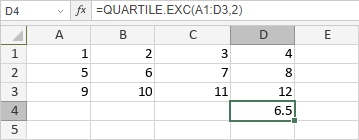
Create VendorExclusive. Enter this complete A1:D3 grid without headers inside the range:
| Row | A | B | C | D |
|---|---|---|---|---|
| 1 | 1 | 2 | 3 | 4 |
| 2 | 5 | 6 | 7 | 8 |
| 3 | 9 | 10 | 11 | 12 |
Put =QUARTILE.EXC(A1:D3,2) in D4. The official illustration shows 6.5, the midpoint of the sixth and seventh observations. In F2 put =QUARTILE.EXC(A1:D3,1) for 3.25; F3 =QUARTILE.EXC(A1:D3,3) gives 9.75. Those two added results follow positions 3.25 and 9.75 in this numeric grid.
Compare conventions on eight measured response times
Create ResponseComparison, reserving A1:J14. Put Minutes in A1 and enter 12,15,18,18,22,27,35,45 in A2:A9. Keep both 18s; each represents a separate observation.
Enter Selector in C1, Exclusive in D1, Inclusive in E1, Percentile check in F1 and Difference in G1. Enter 1,2,3 in C2:C4. Put these formulas in row 2 and fill D2:G2 through row 4:
- D2:
=QUARTILE.EXC($A$2:$A$9,C2) - E2:
=QUARTILE.INC($A$2:$A$9,C2) - F2:
=PERCENTILE.EXC($A$2:$A$9,C2/4) - G2:
=D2-E2
| Selector | Expected D and F | Expected E | Expected G |
|---|---|---|---|
| 1 | 15.75 | 17.25 | -1.5 |
| 2 | 20 | 20 | 0 |
| 3 | 33 | 29 | 4 |
I2 =COUNT(A2:A9) gives 8. I3 =D4-D2 gives an exclusive interquartile range of 17.25 minutes; I4 =E4-E2 gives an inclusive spread of 11.75 minutes.
The lower exclusive position 2.25 gives 15+0.25×(18−15)=15.75. The upper position 6.75 gives 27+0.75×(35−27)=33. Changing the convention changes both the cutoffs and their difference, even though every observation stays the same.
Advanced: adding a real observation changes positions too
Copy ResponseComparison as NineResponses and put a new measured value, 60, in A10. Change D2 to =QUARTILE.EXC($A$2:$A$10,C2), E2 to =QUARTILE.INC($A$2:$A$10,C2) and F2 to =PERCENTILE.EXC($A$2:$A$10,C2/4). Fill D2:F2 through row 4. Leave G’s difference formulas in place and update I2 to =COUNT(A2:A10).
| Selector | Expected D and F | Expected E | Expected G |
|---|---|---|---|
| 1 | 16.5 | 18 | -1.5 |
| 2 | 22 | 22 | 0 |
| 3 | 40 | 35 | 5 |
I2 is 9, I3 becomes 23.5, and I4 becomes 17. The exclusive positions are now 2.5, 5 and 7.5. The new observation affects the sample size as well as the data values. Leaving the formulas at A9 would silently omit it and preserve the old outputs.
Small samples need function-specific care
The exclusive percentile helper in the checked source only interpolates positions between the first and last observations. With three numeric observations, selectors 1 and 3 reach those endpoints. With two observations, their positions would fall outside the observed range. However, the QUARTILE.EXC wrapper has a separate single-value branch, so a blanket claim that it always requires at least three observations would be inaccurate for that code revision.
These exercises use eight, nine or twelve numeric observations and do not depend on those degenerate branches. The help entry does not provide a complete small-sample or error table, and no native small-sample result is asserted here. Check the required contract before building a report around a one- or two-record subset.
Interpretation and related functions
QUARTILE.INC uses inclusive positions and also documents selectors 0 and 4. The legacy QUARTILE follows that inclusive calculation in the checked source. PERCENTILE.EXC accepts a probability fraction instead of the quartile selector, with its own finite-sample boundaries.
Quartiles summarize the selected sample. They are not confidence limits, and tied or interpolated cutoffs do not guarantee an exact percentage of records on either side. Keep one convention throughout a comparison.
Use complete numeric input ranges for these examples. Blank, text, Boolean and error branches are not interchangeable across the checked functions; native mixed-type, fractional-selector and precision behavior remains outside this calculation check. Keep headers separate and use the documented integer selectors.