

ONLYOFFICE QUARTILE: Five-Number Summaries and Delivery-Time Examples
Use ONLYOFFICE QUARTILE and its QUARTILE.INC alias for five-number summaries, repair-cost examples and clearly stated version limits.
Verification status: See the evidence and test scope described in this guide. How formula examples are checked
QUARTILE summarizes a numeric dataset at its minimum, lower quartile, median, upper quartile or maximum. The second argument is an integer selector, not a percentage: use 1 for the 25th percentile and 3 for the 75th percentile.
Availability and version history
- Introduced: The original introduction release and date are not established by the checked references; related percentile release dates are not assigned to this function.
- Availability: Documented in current ONLYOFFICE Spreadsheet Editor help; no final supported-version endpoint is established.
- Scope: Desktop and Docs release separately. The checked source revision does not establish identical behavior on every deployment, mobile client or older build.
- Checked: October 14, 2026, against the official QUARTILE reference, vendor illustration and pinned source. Worked outputs were independently calculated; no native quartile test was performed.
Syntax and the five selectors
QUARTILE(array, quart)
Both arguments are supplied. The official reference defines the following selectors:
| quart | Requested result |
|---|---|
| 0 | Minimum |
| 1 | First quartile, or 25th percentile |
| 2 | Second quartile, or median |
| 3 | Third quartile, or 75th percentile |
| 4 | Maximum |
The examples use complete numeric ranges and these integer selectors. The pinned official implementation uses the inclusive percentile convention for selectors 0, 1, 3 and 4, and the median for selector 2. For sorted data containing n observations, the corresponding one-based position is h=1+(n−1)×quart/4. A fractional position interpolates between its two neighboring values. The QUARTILE.INC name inherits this calculation in the same source revision.
Reproduce the vendor’s twelve-value grid
Create a VendorQuartile sheet. Enter these numbers in A1:D3 without a header row inside the selection:
| Row | A | B | C | D |
|---|---|---|---|---|
| 1 | 1 | 2 | 3 | 4 |
| 2 | 5 | 6 | 7 | 8 |
| 3 | 9 | 10 | 11 | 12 |
In D4 enter =QUARTILE(A1:D3,3). The vendor illustration displays 9.25. The position is 1+11×3/4=9.25, so the result is one quarter of the way from the ninth value, 9, to the tenth, 10.
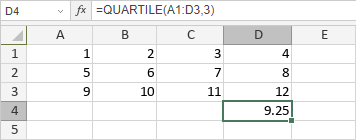
The whole rectangular range supplies twelve observations. Selecting only A1:A3 would instead use 1,5,9, changing both the sample size and the result.
Build a five-number delivery-time summary
On a separate DeliveryDays sheet, reserve A1:H12. Put Days in A1 and enter 2,3,4,4,5,6,9,15 in A2:A9. These are eight observations; the repeated 4 is intentional.
Put Selector in C1 and Days in D1. Enter 0,1,2,3,4 in C2:C6. Put =QUARTILE($A$2:$A$9,C2) in D2 and fill through D6.
| Row | Selector | Expected days |
|---|---|---|
| 2 | 0 | 2 |
| 3 | 1 | 3.75 |
| 4 | 2 | 4.5 |
| 5 | 3 | 6.75 |
| 6 | 4 | 15 |
In G2 enter =COUNT(A2:A9) for 8. In G3 enter =D5-D3 for an interquartile range of 3 days. The median is (4+5)/2=4.5; it need not be one of the recorded durations.
For a direct interpolation control, G5 =3+0.75*(4-3) gives the lower quartile 3.75. G6 =6+0.25*(9-6) gives the upper quartile 6.75. The range between those two cutoffs describes the middle portion of this sample under this convention; it is not a confidence interval for a population parameter.
Advanced: inspect a changed extreme without overwriting the sample
Copy DeliveryDays as DelayedShipment and change only A9 from 15 to 150. The existing D2:D6 formulas now return 2,3.75,4.5,6.75,150. G2 stays 8 and G3 stays 3. The two hand controls still describe the same neighboring values.
This one change alters the maximum without altering either quartile because, in this eight-value sample, the upper-quartile interpolation uses the sixth and seventh observations. It does not prove that quartiles are immune to unusual observations in every dataset. Changing 9, adding rows or selecting a different convention can change the upper quartile.
Create another copy of the original DeliveryDays called Hours. Replace A2:A9 with 48,72,96,96,120,144,216,360, multiplying each duration by 24. Rename A1 and D1 to Hours. D2:D6 become 48,90,108,162,360, and G3 becomes 72 hours. Update G5 to =72+0.75*(96-72) for 90 and G6 to =144+0.25*(216-144) for 162. Both the quartiles and their spread scale with the units.
QUARTILE.INC alias and name availability
The official QUARTILE.INC reference documents the same two arguments and inclusive selectors as QUARTILE. In the pinned source, the .INC name directly inherits the legacy calculation and argument contract; only its name/registration metadata differs. Both documented names are covered here, while QUARTILE.EXC remains a separate convention.
The checked references do not establish the original introduction of either QUARTILE or QUARTILE.INC. The full saved Desktop changelog has no explicit entry for these names, so the documented PERCENTILE.INC 4.4.1 addition must not be applied to them. Both quartile names remain in current help; no final supported endpoint is established.
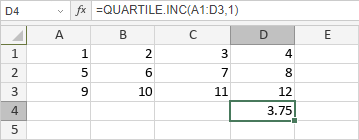
On VendorQuartile, put =QUARTILE.INC(A1:D3,1) in F4. The separate INC illustration shows 3.75. F2 =QUARTILE.INC(A1:D3,2) and F3 =QUARTILE.INC(A1:D3,3) have additional calculated results 6.5 and 9.25. Keep D4’s original legacy formula intact.
Summarize seven repair invoices
Create RepairCosts, reserving A1:J14. Put Amount in A1 and enter 40,55,70,90,120,160,240 in A2:A8. Use numbers, with any desired currency display format; no currency symbols are part of the underlying inputs.
Enter Selector in C1, Inclusive in D1, Legacy in E1, Percentile check in F1 and Difference in G1. Put 0,1,2,3,4 in C2:C6. Enter these formulas in row 2 and fill D2:G2 through row 6:
- D2:
=QUARTILE.INC($A$2:$A$8,C2) - E2:
=QUARTILE($A$2:$A$8,C2) - F2:
=PERCENTILE.INC($A$2:$A$8,C2/4) - G2:
=D2-F2
| Selector | Expected D, E and F |
|---|---|
| 0 | 40 |
| 1 | 62.5 |
| 2 | 90 |
| 3 | 140 |
| 4 | 240 |
G2:G6 are 0. I2 =COUNT(A2:A8) returns 7. I3 =D5-D3 gives an interquartile range of 77.5. The lower quartile averages the second and third observations, 55 and 70; the upper averages the fifth and sixth, 120 and 160.
The percentile check converts selector 1 to 0.25 and selector 3 to 0.75. Passing the selector directly to PERCENTILE.INC would ask a different question or exceed its domain.
Advanced: separate a fixed fee from relative price variation
Copy RepairCosts as WithFee. Replace A2:A8 with 55,70,85,105,135,175,255, adding a fixed 15 to each original invoice. Keep selectors unchanged. D, E and F now return 55,77.5,105,155,255, while G remains zero and I3 remains 77.5.
Every quartile shifts by the same fixed fee, but the interquartile range does not. That spread measures a difference, so a shared additive charge cancels. It does not mean the typical invoice stayed the same: the median increased from 90 to 105.
On a separate copy of the original RepairCosts named RevisedMiddleCost, change only A4 from 70 to 100. The original row order is now 40,55,100,90,120,160,240; do not manually sort the sheet or move formulas. The calculation sorts the selected values internally for this model.
The five expected outputs become 40,72.5,100,140,240 in each of D, E and F. I3 becomes 67.5. In sorted order the second and third observations are 55 and 90, so their midpoint is 72.5. The revised 100 is the fourth observation and therefore the median. This distinguishes a changed value from merely changing the order of unchanged values.
Choose and record the convention
QUARTILE.INC makes the inclusive naming explicit. QUARTILE.EXC uses a different interpolation position for the lower and upper quartiles. PERCENTILE.INC accepts a fractional percentile input instead of this 0–4 selector.
Different ways of dividing an ordered sample into quarters can disagree. Record the function used when comparing reports. A quartile is a cutoff value, not a guarantee that exactly one quarter of a small or tied sample falls strictly below it.
Input boundaries and troubleshooting
Keep text headers outside A2:A9 and preserve the distinction between a measured zero and an unrecorded duration. The checked code has type-specific branches, so the results above must not be generalized to blanks, Boolean values, numeric text or errors. COUNT verifies the eight explicitly numeric inputs here, rather than certifying every possible mixed range.
Use the documented integer selectors. Fractional selectors, invalid-input error labels, singleton behavior and extreme floating-point precision have not been tested in an installed build. These scalar examples also make no claim about imported array formulas or identical behavior across Desktop, Docs and mobile releases.