

PlanMaker Z.TEST Function: Calculate a one-sided normal test probability
Use Z.TEST (legacy ZTEST) in FreeOffice PlanMaker 2024 with explicit statistical meaning, worked inputs, independent calculations and precision limits.
Verification status: See the evidence and test scope described in this guide. How formula examples are checked
Quick answer: for 30 observations alternating 4 and 6, =Z.TEST(A2:A31,4,SQRT(30)) returns approximately 0.1586552539 in the tested build. The standardized statistic is z=1; the native result is its upper-tail probability, not the statistic itself.
Syntax and null mean
=Z.TEST(Area, x [, Sigma])
=ZTEST(Area, x [, Sigma])
Area contains the observed sample. x is the hypothesized population mean against which the observed sample mean is compared. Optional Sigma is a known population standard deviation, not a variance. If omitted, the official help says PlanMaker uses the sample’s standard deviation.
The reference recommends at least 30 observations; the worked dataset supplies 30. Sample size alone does not establish random sampling, independence, or normal-model adequacy. A p-value is a tail probability under the null model, not the probability that the sample “comes from” that population or that the null hypothesis is true.
For the independent normal-tail model, the statistic and upper-tail probability are:
z = (sample_mean - hypothesized_mean) / (sigma/sqrt(n))
p = P(standard_normal >= z)
When Sigma is omitted, substitute the sample standard deviation in that expression. This does not automatically change the function into a Student t-test.
Enter 30 reproducible observations
In a blank worksheet, fill A2:A31 with 15 repetitions of the pair 4,6. A2 is 4, A3 is 6, A4 is 4, and so on, ending with A30=4 and A31=6. The two values each occur 15 times; do not enter a value-frequency summary as if it were the sample itself.
The count is 30, sum 150, and arithmetic mean 5. For the first controlled example, the supplied population Sigma is sqrt(30). This is a chosen model parameter for transparent arithmetic, not an estimate from these observations. Its standard error is sqrt(30)/sqrt(30)=1.
Enter =Z.TEST(A2:A31,4,SQRT(30)) in J2. The null mean is 4, so z=(5−4)/1=1. The independent upper-tail probability is approximately 0.1586552539. The legacy =ZTEST(A2:A31,4,SQRT(30)) uses the same inputs.
Check direction and the optional Sigma
| Formula | Independent expected probability |
|---|---|
=Z.TEST(A2:A31,4,SQRT(30)) |
0.1586552539 |
=Z.TEST(A2:A31,5,SQRT(30)) |
0.5 |
=Z.TEST(A2:A31,6,SQRT(30)) |
0.8413447461 |
=Z.TEST(A2:A31,4.8) |
0.1407327702 |
Increasing the null mean to 6 makes z negative, so the upper-tail probability exceeds 0.5. It is not correct to take an absolute value and keep calling that result the same one-sided test.
For the omitted-Sigma row, squared deviations from sample mean 5 sum 30. The sample variance is 30/29, so the sample standard error is 1/sqrt(29). The null mean 4.8 gives z=0.2×sqrt(29)≈1.0770329614, and the independent upper-tail probability is 0.1407327702. This explicitly distinguishes the sample denominator n−1 from a population-variance denominator n.
Practical use: one-sided versus two-sided questions
For the symmetric normal-tail model, a two-sided probability can be constructed as:
=2*MIN(Z.TEST(A2:A31,4,SQRT(30)),1-Z.TEST(A2:A31,4,SQRT(30)))
The independent result is approximately 0.3173105079. Do not double every one-sided probability blindly: a value above 0.5 must first be replaced by its smaller complementary tail.
Choose the alternative hypothesis before looking at the result. Switching between one-sided and two-sided interpretations after observing the sign changes the statistical question. A p-value alone does not report an effect size, establish practical importance, or give the probability that a hypothesis is true.
If Sigma is estimated from a small sample and a t procedure is appropriate, using a normal-tail formula with estimated Sigma does not supply that t procedure. This guide explains the function’s mechanics rather than selecting a statistical method for a particular study.
Errors and degenerate samples
A supplied Sigma of 0 makes the standard error zero. A constant sample with omitted Sigma also has zero estimated spread. In the tested build, =Z.TEST(A2:A31,4,0) and =Z.TEST(C2:C31,5) both return #DIV/0!. The single-observation known-Sigma call =Z.TEST(A2:A2,4,SQRT(30)) returns 0.5 because the selected value equals the null mean. This does not override the documentation’s sample-size recommendation or establish that a one-observation study supports the intended statistical inference.
For the constant-data control, put 5 in C2:C31 and evaluate =Z.TEST(C2:C31,5). Keep that case separate from a valid nonconstant sample whose observed mean equals the null mean and produces p=0.5 in the mathematical model.
Text, logical, blank, and error-valued observations are not exhaustively specified on the short function page. The primary dataset is numeric. Verify the actual contributing count and data type before using imported records.
Legacy spelling and related functions
The official ZTEST page calls Z.TEST identical, not retired. The Excel 2010 compatibility note does not establish the first PlanMaker release supporting the function. Use the locale’s required formula separators.
NORM.DIST helps explain the normal-tail probability; AVERAGE and COUNT audit the sample mean and size. Keep the observed data, null mean, Sigma choice, and test direction visible with the reported probability.
Native results and visible precision
The native main probability is approximately 0.158655253931457, matching the known-Sigma calculation; ZTEST gives the same saved result. The omitted-Sigma example returns approximately 0.140732770216210, and the two-sided construction approximately 0.317310507862914. The input values and 30-record count were verified separately in the saved workbook.
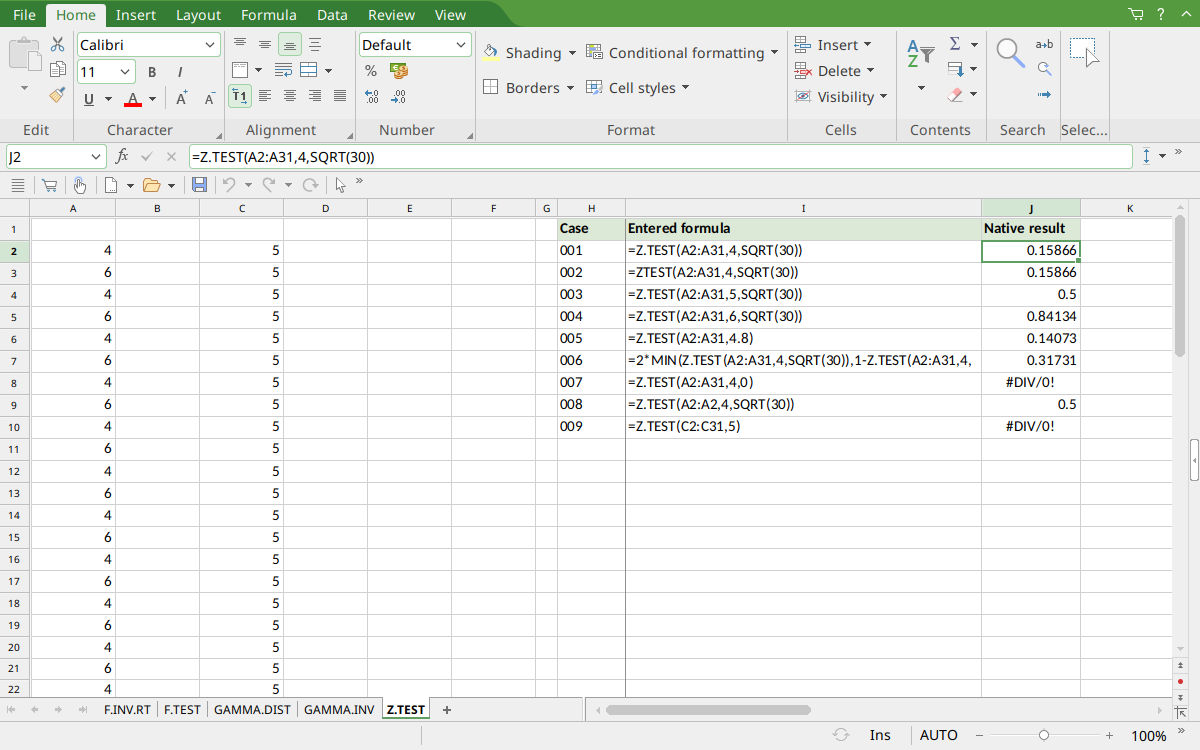
FreeOffice PlanMaker 2024 rev F1238.1005: selected cell J2 contains =Z.TEST(A2:A31,4,SQRT(30)) and displays 0.15866. Raw saved values retain more digits; rounded display values are not asserted as exact mathematical equality.
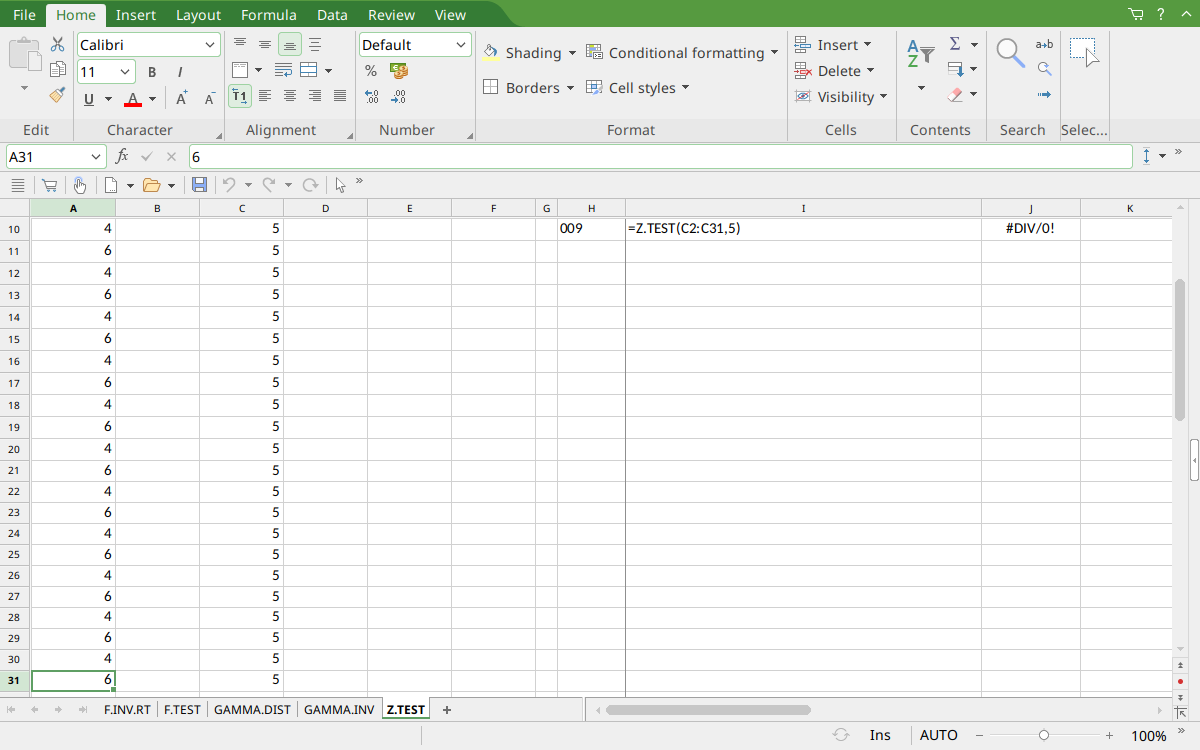
The same reopened workbook, scrolled to the lower input rows. Selected A31 contains 6, completing the 30 alternating 4/6 observations in A2:A31. This view complements the upper rows in the main capture; the complete two-sided formula is given in the worked example above because its label is clipped in the main screenshot.
Version and evidence scope
Official FreeOffice PlanMaker 2024 references checked October 18, 2026: reference 1, reference 2. The first introduction release is unknown from these references. Current documentation does not imply retirement or identical behavior in every other edition.
The 9 selected formula cells for this function were tested on October 18, 2026 in FreeOffice PlanMaker 2024 rev F1238.1005, 64-bit, then saved in PMDX format and reopened with calculation meaning preserved. Paired legacy calls were included. Native observations remain distinct from independent mathematical references, teaching layouts, and advanced examples not individually executed. The proprietary implementation has not been inspected; the bounded results do not establish every tail, parameter, input type, edition, or export behavior.